Ethereum has bounced back around 1503 and is now fluctuating around 1640. On the daily chart, Ethereum is still in a downward channel, with the price running close to the lower boundary. Meanwhile, on the four-hour chart, the Bollinger Bands are gradually narrowing, with resistance at the 1700 to 1720 range and support around 1570 to 1550 dollars. The bullish red bars are slowly decreasing in volume, the KDJ three lines are diverging downwards, and there is no clear bullish signal, so the overall trend is downward, thus the operation mainly focuses on short positions.
Enter short positions around 1640-50, targeting 1600-1580, and if broken, watch for 1550-1540.
Bitcoin has been operating below the lower Bollinger Band for many days, and the Bollinger Bands' opening is still downward, with both the upper and lower bands pressing down together. The bearish green MACD bars have shortened but are still below the zero line. On the four-hour chart, after the price bounced back to the middle Bollinger Band, it began to weaken, with bullish volume bars rapidly decreasing. At the same time, the fast and slow lines are converging below the zero line, forming a death cross trend, and the KDJ three lines are diverging downwards, so the operation for Bitcoin is also mainly focused on short positions.
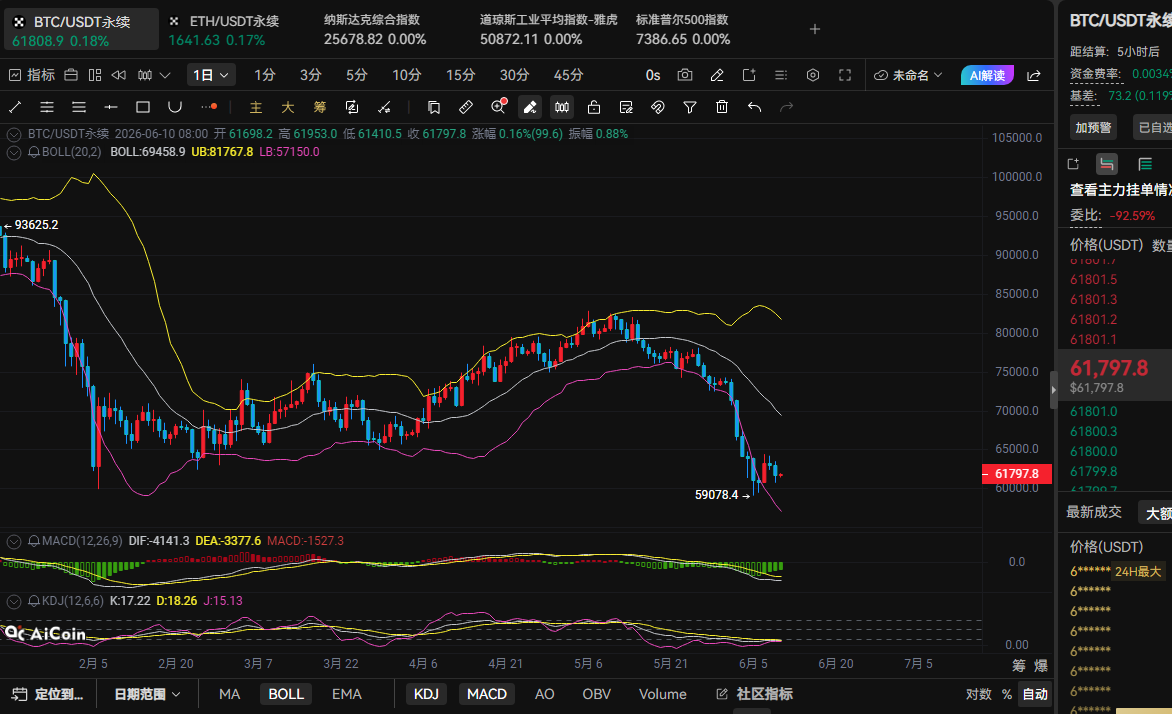
It is recommended to enter short positions around 61800-62300, targeting 60800-60000, and if broken, watch for around 59500.
The market is changing rapidly, and strategies are for reference only; maintain proper stop-loss and take-profit measures.

免责声明:本文章仅代表作者个人观点,不代表本平台的立场和观点。本文章仅供信息分享,不构成对任何人的任何投资建议。用户与作者之间的任何争议,与本平台无关。如网页中刊载的文章或图片涉及侵权,请提供相关的权利证明和身份证明发送邮件到support@aicoin.com,本平台相关工作人员将会进行核查。


