Last night, the U.S. stock market opened high and fell low, with the price of Bitcoin attempting to rise several times but failing to break through effectively, instead coming under pressure and falling back. The price directly dropped after the U.S. stock market, reaching a low of around 60700, but fortunately, it did not continue to decline. Therefore, today we can use the 60700 mark as current support; as long as it does not fall below this during the day, the price will likely rise again.
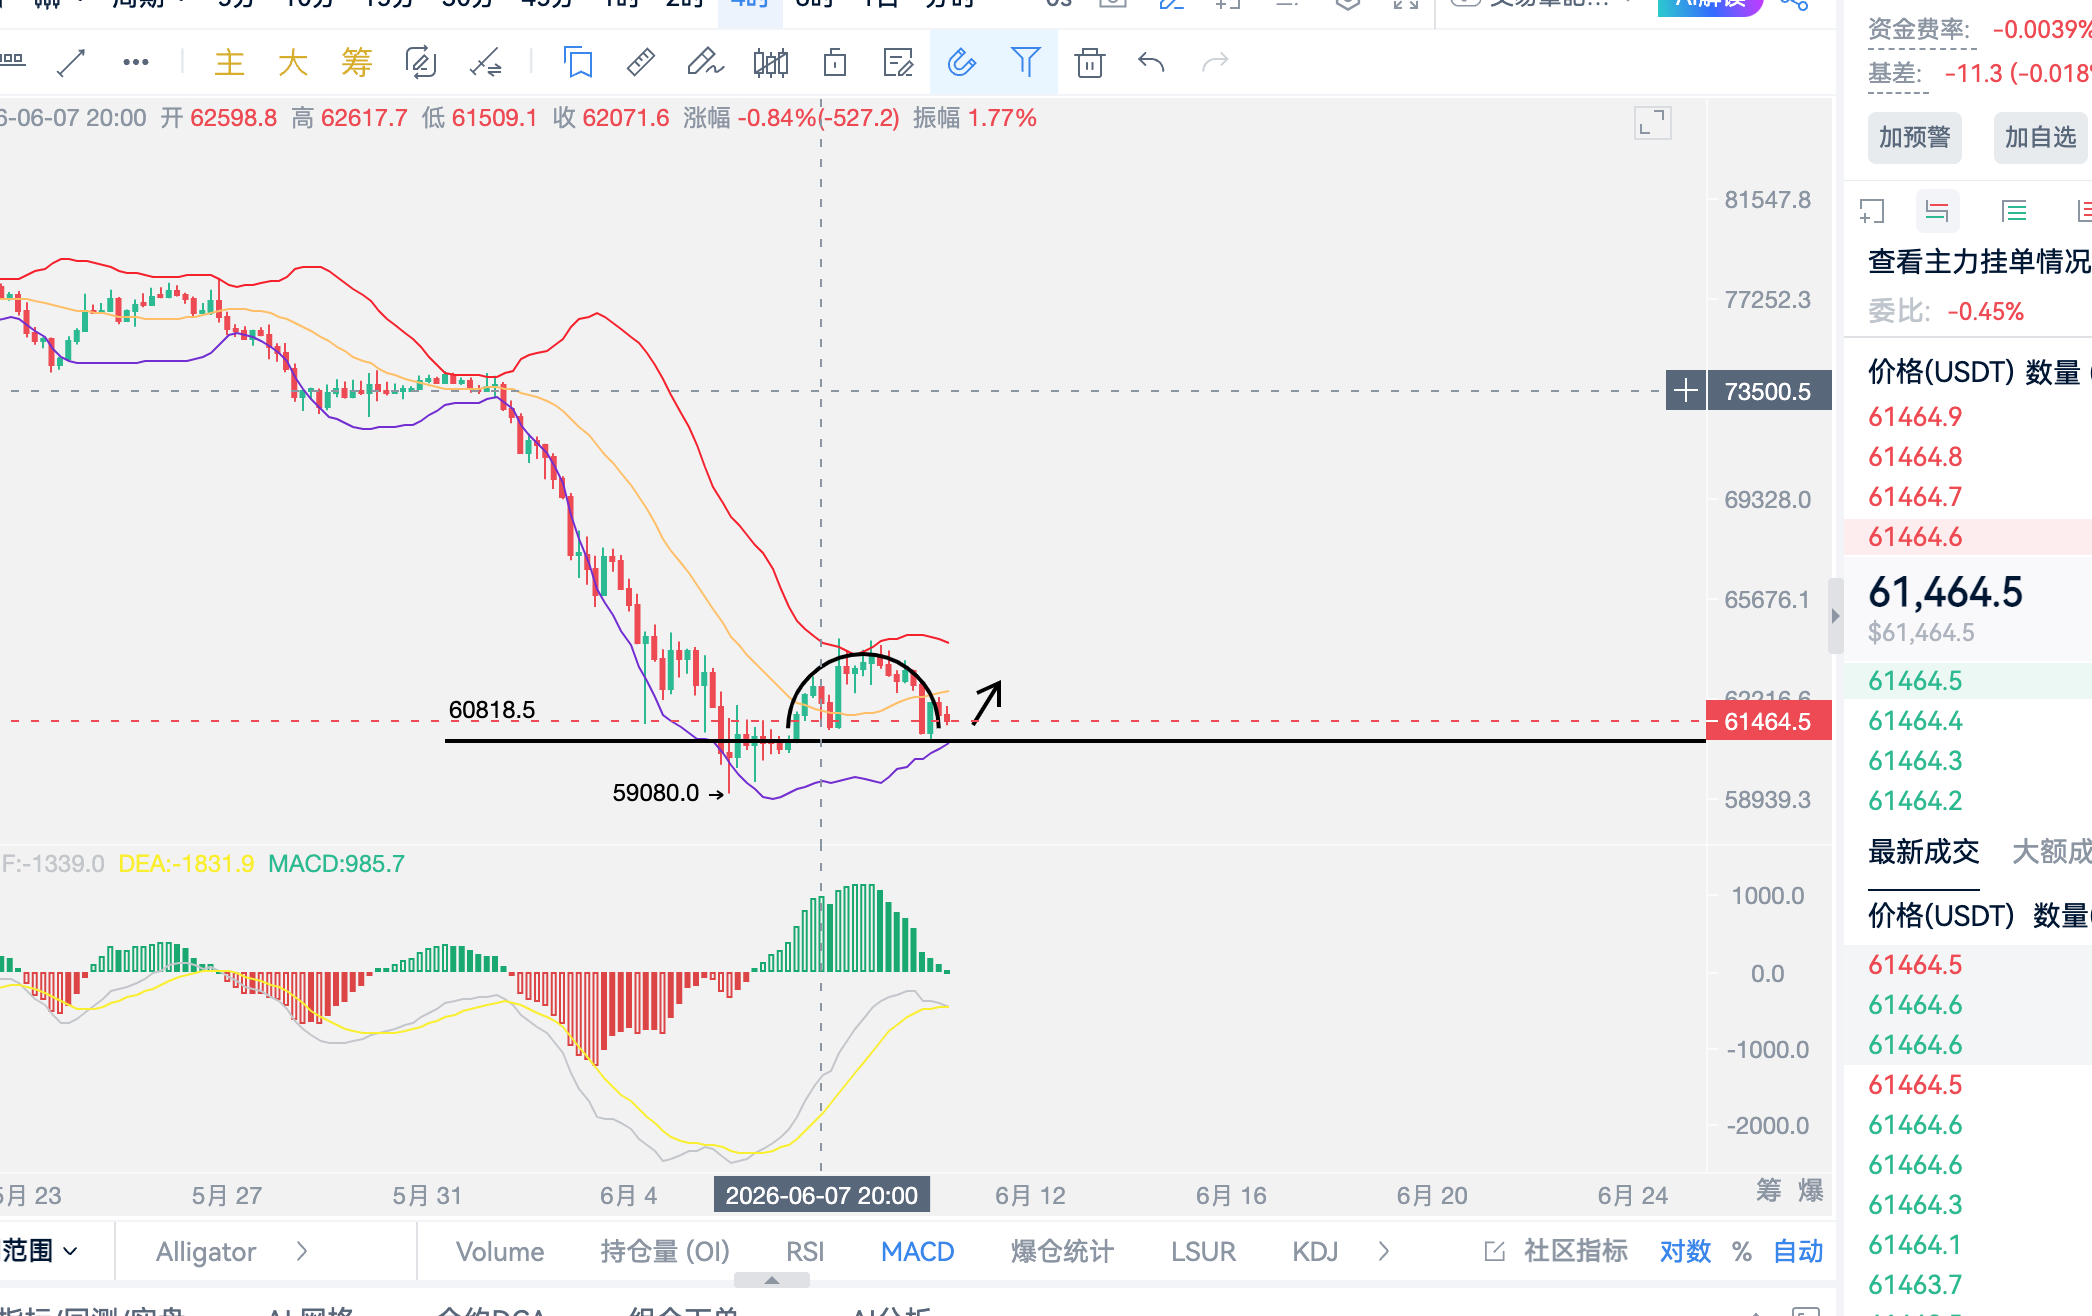
On the four-hour level, the Bollinger Bands show an opening upward squeeze, indicating that price fluctuations are not likely to develop into a large one-sided movement in the short term. The K-line is currently operating in the middle-lower track area, and we can consider the lower track as current support. We should look for bullish signals on any pullbacks.
On the daily level, the position remains fluctuating. After a large bullish candle, three smaller bearish candles have returned to the position; however, the MACD indicator shows a reduction in bearish momentum, so the overall direction still indicates a bullish pattern when retracing.
The intraday strategy can maintain a bullish outlook in the 60700-60900 range, targeting to gradually look toward the 64000 mark; the levels are for reference only.
Follow the public account, how to alleviate worries, only Jiang Wei, a treasure analysis blogger filled with emotional value, shares trading education for free, bringing stability and clear guidance in the restless trading market, traversing through three cycles of bull and bear markets and years of practical trading experience, specializing in naked K, trends, Dow Theory, Gann, harmonic analysis, Chen Theory, wave theory, and other technical analyses, consolidating into unique personal insights.

免责声明:本文章仅代表作者个人观点,不代表本平台的立场和观点。本文章仅供信息分享,不构成对任何人的任何投资建议。用户与作者之间的任何争议,与本平台无关。如网页中刊载的文章或图片涉及侵权,请提供相关的权利证明和身份证明发送邮件到support@aicoin.com,本平台相关工作人员将会进行核查。


