Hello everyone, welcome to today's Ethereum market analysis, today is June 8, 2026.
This week, Ethereum's trend has been very thrilling, plummeting from $2000 to $1540 in one go, a decline of over 20%. However, today, the price has shown a significant rebound, now around $1684. Will this rebound be sustained? What are the key price levels today? I will provide a detailed analysis.
ETH has sharply declined from $2,000 to $1,540 this week, a drop of over 23%, and today it rebounded to $1,684. ETF continues to see massive outflows, major whales show significant divergence, and the technical aspect is just beginning to recover. $1,680 is the watershed between bulls and bears; whether it can hold will determine the subsequent trend, and short-term operations need to be extremely cautious.
First, let's talk about what has happened in the market these days to clarify the logic behind the trend.
First, the bearish factors that led to this sharp decline.
The first is the continuous outflow of ETF funds. The U.S. Ethereum spot ETF had a net outflow of over $400 million throughout May, and it has continued to flow out into June. This indicates that institutional investors are withdrawing money, which is currently the biggest bearish pressure, directly driving prices down.
The second is that macroeconomic pressures have not eased. U.S. inflation data remains high, and expectations of interest rate cuts by the Federal Reserve are being postponed, leading to a generally low-risk sentiment in the market; everyone is hesitant to take risks by buying.
The third is the market sentiment index. The current fear and greed index of the cryptocurrency market is only 12 points, falling within the "extreme fear" range, indicating very pessimistic market sentiment.
Now, let's talk about the bullish factors that support the price.
The first major news is that a very interesting transaction occurred on-chain today. An address known in the industry as an "Ethereum veteran" sold $141 million worth of ETH around $2040 a few weeks ago. However, today, they repurchased 35,700 ETH at a low of $1563 for $55.8 million. This indicates that this smart money believes that the current price is worthwhile, and they are bottom-fishing.
The second bullish factor is the upcoming Ethereum network upgrade in June called "Glamsterdam," which can increase transaction processing speed by three times. This is an important technical catalyst, but currently, the market is still observing and has not yet reflected this in the price.
The third is that on-chain data shows that the holding volume of Ethereum whales reached the highest point in nearly ten weeks in the first week of June, indicating that large holders are quietly increasing their positions.
In summary: the bearish side is that institutional ETFs are selling, and the bullish side is that smart large holders are buying; these two forces are in a tug-of-war, and the market is at a critical turning point.
Now, let's look at the charts. This is the 60-minute candlestick chart of Ethereum, covering the period from June 1 to June 8.
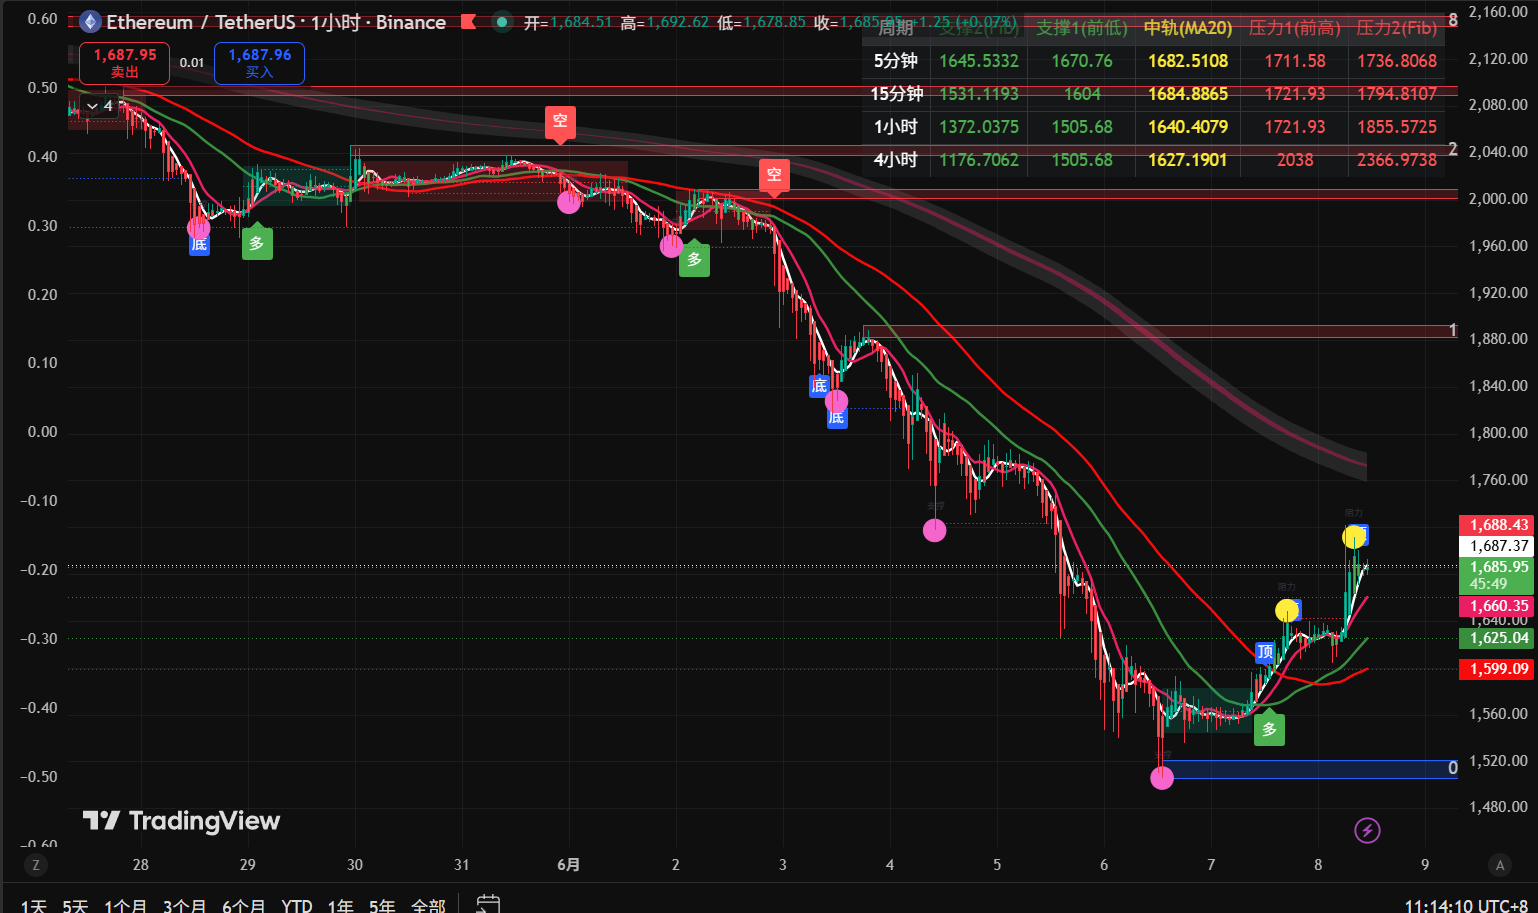
First, let's discuss the overall trend. You can see that the shape of the chart is very clear: starting from June 1, the price dropped continuously like a waterfall from around $2000 to the lowest point of approximately $1540 on June 6, a total drop of $460, exceeding 23%. This was a very sharp one-sided decline.
However, from June 7 to June 8, marked on the right side of the chart, the price showed a significant V-shaped rebound, quickly rising to around $1684 from the low. This rebound was nearly 10%, quite substantial.
Now let's look at the two moving averages on the chart. The red line is the short-term moving average and the green line is the long-term moving average. You can clearly see that during the downtrend, the red line kept pushing down the green line, and the moving average system was completely in a bearish arrangement. But on the far right, the two moving averages started to show signs of converging and crossing, which is a preliminary technical reversal signal, but further confirmation is still needed.
Regarding key price levels, I have marked the most important numbers for you.
Support below: The first support is the low we just fell to, in the range of $1540 to $1560, where there are large holders bottom-fishing today, indicating a strong support here. The second support is at $1500, which is a psychological barrier.
Resistance above: The first resistance is the high of the rebound today, between $1680 and $1700, which is also a key level for Fibonacci retracement; the price is currently testing this level. The second resistance is at $1750, and the third is at $1800; a breakout of $1800 would indicate a true technical turnaround.
Currently, in terms of candlestick patterns, the V-shaped rebound from the bottom is a positive signal, but the duration of the rebound is still short, and the trading volume needs to increase further to verify this, so we cannot yet determine if this is a true reversal; it could just be a temporary rebound.
Now, let's discuss today's operational strategies. I have three directions for you; choose based on your situation.
The first direction is for those looking to go long and are bullish.
The price is currently at $1684, having just rebounded from a low, making chasing highs quite risky. I suggest two ways to enter the market: The first way is to wait for the price to retrace to $1620 to $1650, confirm that this position has support, and then enter in batches, with the first target at $1750 and the second at $1800. Set a stop-loss below $1590; if it breaks, exit. The second method is to wait for the price to clearly break above $1700 and firmly hold that position, then enter with a light position, targeting the same $1750 and $1800.
The second direction is for those who are already holding positions that are underwater.
If you are stuck above $2000, I do not recommend continuing to hold a heavy position. You could reduce part of your position when the price rebounds to $1700 to $1750 to alleviate pressure. Decide what to do once the price direction becomes clearer.
The third direction is for those with no position who are observing.
This is currently the safest state; there is no need to rush into the market. First, wait to see how the market behaves at the $1680 to $1700 level and if it can hold. If several hourly candlesticks can close above this level consistently, it indicates that the bullish strength is increasing, and entering at this point would have a higher probability of success.
Remember one principle: this kind of rebound after a deep correction from a high position can easily make people feel like it has "reversed," leading to chasing highs and getting stuck. Position control is the most important; do not exceed 20% to 30% of total funds in a single entry.
Finally, the risk warning is very important, so please listen carefully.
Today, there are three main risks.
The first risk is that the rebound could just be a "dead cat bounce." The so-called dead cat bounce refers to a brief rebound in price after a significant drop, followed by more downward movement. Currently, ETF funds are still flowing out, and macro pressures have not eased, so this rebound could just be a technical recovery, not indicating a trend reversal. If $1680 cannot hold, the price may fall back to $1540 or even lower.
The second risk is that high leverage must absolutely be avoided. In such a volatile market, using high leverage could result in immediate liquidation if the direction is judged incorrectly. The current market fear index is only 12 points; during extreme fear, any slight fluctuation could provoke a chain liquidation.
The third risk is that there are many trapped positions above $1800. From the chart, it's evident that many people bought near $2000 and are currently trapped; when the price rebounds to their break-even area, they are likely to choose to exit and realize their losses, creating significant selling pressure. Therefore, $1800 is a very difficult resistance area to break through.
Response strategy: Strictly set stop losses, do not gamble. Avoid high leverage. Do not exceed 30% of your position in a single trade. Wait for clear signals, and do not act impulsively.
Well, that concludes today's complete market analysis of Ethereum.
Let's quickly summarize: ETH has plunged over 23% this week, rebounding to $1684 today, with $1680 being the key watershed between bulls and bears. Institutional ETFs are still flowing out, but large holders have started to bottom fish. In terms of operations, wait for a retracement to $1620 to confirm support before entering, with a strict stop loss at $1590, avoid high leverage, and focus on light positions.
If today's analysis was helpful to you, please like and subscribe; we will update the latest market analysis for you every day. See you next time!
Disclaimer: The above content is for informational purposes only and does not constitute any investment advice; the cryptocurrency market is highly risky, please make decisions cautiously based on your own situation.

免责声明:本文章仅代表作者个人观点,不代表本平台的立场和观点。本文章仅供信息分享,不构成对任何人的任何投资建议。用户与作者之间的任何争议,与本平台无关。如网页中刊载的文章或图片涉及侵权,请提供相关的权利证明和身份证明发送邮件到support@aicoin.com,本平台相关工作人员将会进行核查。