Academician of the Crypto Circle: 6.9 Bitcoin Fibonacci resistance is intercepting layer by layer, rebound space is limited! Latest market analysis and operational advice
Bitcoin current price is 63400, short-term contract speculation is speculation, while the mindset of holding cash must be separated. A short-term plunge is just a normal retracement in the cycle, and there is no need to let a single day’s rise and fall drive your emotions. For short-term trading, strictly adhere to the trend and stop-loss; for long-term trading, gradually accumulate at low points and do not go all in at once. Market fluctuations are normal; being impatient to recover losses or double your investment is the easiest way for operations to become distorted. Maintain a calm mindset, endure oscillations and withstand fluctuations. The essence of trading is to combat your own greed and fear, and only by controlling your hands and stabilizing your heart can you establish a long-term presence in the crypto circle.
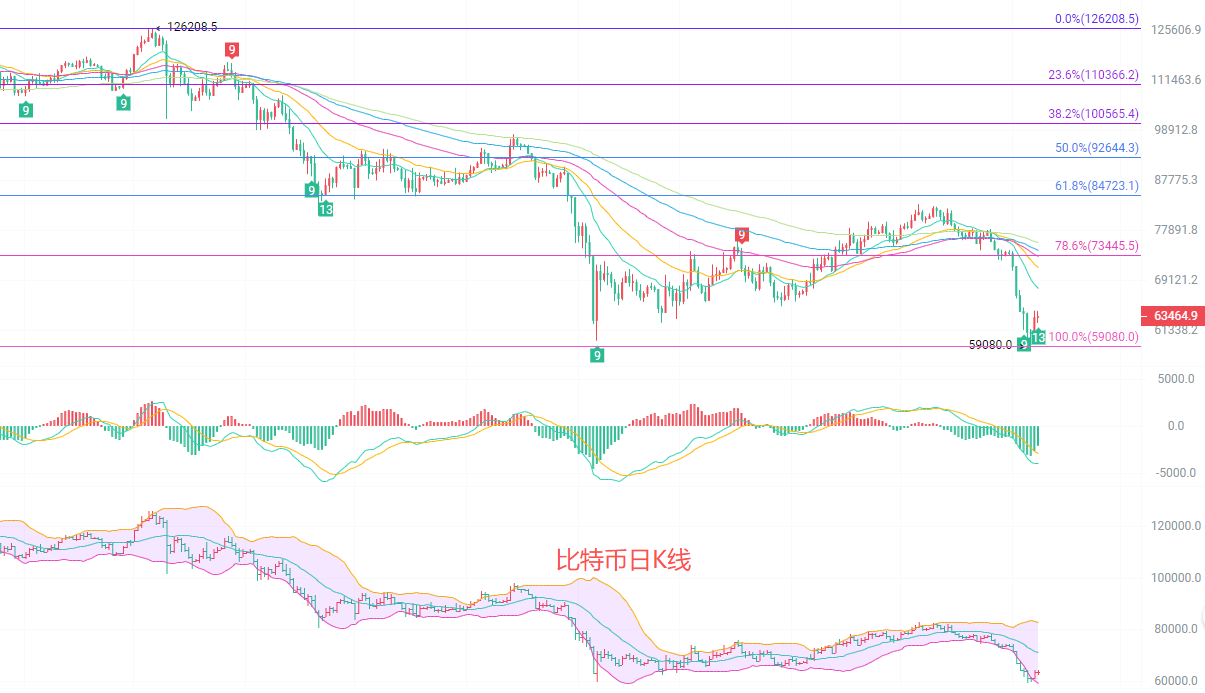
The daily K-line shows a comprehensive downward trend with no signs of change. All medium to long-term EMA moving averages are forming layers of pressure, with 73445 above being the core heavy resistance. The price has dropped significantly from the previous high of 126208. The MACD shows a sustained high volume of green bars moving downward, with no signs of a decrease in downward momentum; the Bollinger Bands are widening significantly downward, with the lower band at 59108 constituting the only strong support. If the previous low of 59080 is breached, there will be no effective support space below, which will further open downward motion. The slight intraday fluctuations are merely a brief respite after heavy overselling; under the arrangement of downward moving averages, the strength of the rebound will be extremely weak, and there have been no reversal stabilization signals on the daily level, such as bottom divergence or significant bullish candles.
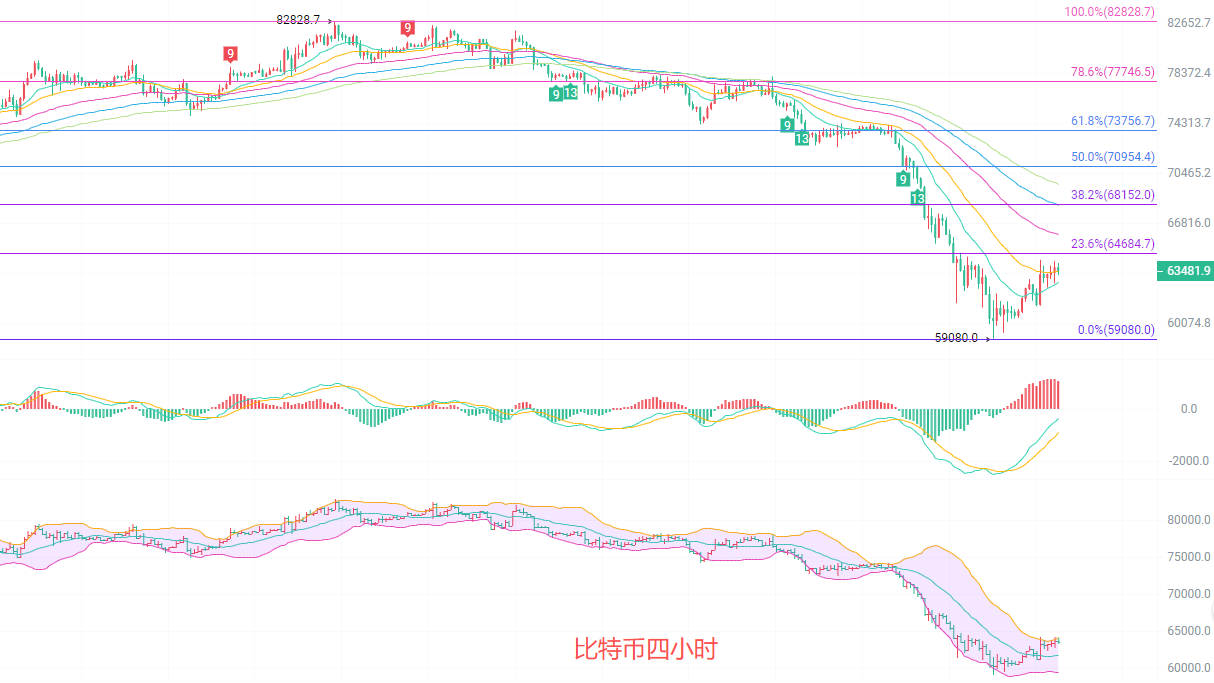
The four-hour K-line shows a clearly defined complete downward structure, with the high point of the drop at 82828 and the bottom support at 59080. The short-term price has slightly rebounded to test the 0.236 resistance at 64684, while the EMA short moving averages are exerting pressure throughout, making it difficult for the rebound to stabilize above the moving averages. The MACD shows a brief recovery golden cross, which is part of the oversold buffer recovery after a large drop, and does not indicate a trend reversal; the overall direction of the Bollinger Bands is tilted downwards, with the upper band at 64193 pressing down on the price and the middle band at 68152 being a medium-term strong pressure. The four-hour rebound space is firmly locked, and unless it can stabilize above 64700, it will inevitably start a downward trend again after the recovery ends, and do not mistake the slight rebound as a trend reversal initiation.
Short-term strategy reference: follow the macro trend, quick entry and exits with small stop losses
Buy in the range of 59000 to 59500, with a stop loss at 58500, targeting 61000 to 62000
Sell in the range of 64500 to 65000, with a stop loss at 65500, targeting 61500 to 60000
Specific actions should be based on real-time market data. For more information, you can consult the author. There may be delays in article publishing, so suggestions are for reference only, and risks are self-assumed.

Warm reminder: The above content is solely created by the author. The advertisements at the end of the article and in the comments section are unrelated to the author. Please discern carefully. Thank you for reading.
免责声明:本文章仅代表作者个人观点,不代表本平台的立场和观点。本文章仅供信息分享,不构成对任何人的任何投资建议。用户与作者之间的任何争议,与本平台无关。如网页中刊载的文章或图片涉及侵权,请提供相关的权利证明和身份证明发送邮件到support@aicoin.com,本平台相关工作人员将会进行核查。