Today we continue to talk about technical analysis, and I want to share with you a treasure indicator I have kept private for a long time — Ichimoku Cloud. Many people find it complex and difficult to understand, but actually, as long as you grasp the core, it is much more useful than common indicators like moving averages and MACD. It can help you see trends, find support and resistance at a glance, and accurately locate buy and sell points.
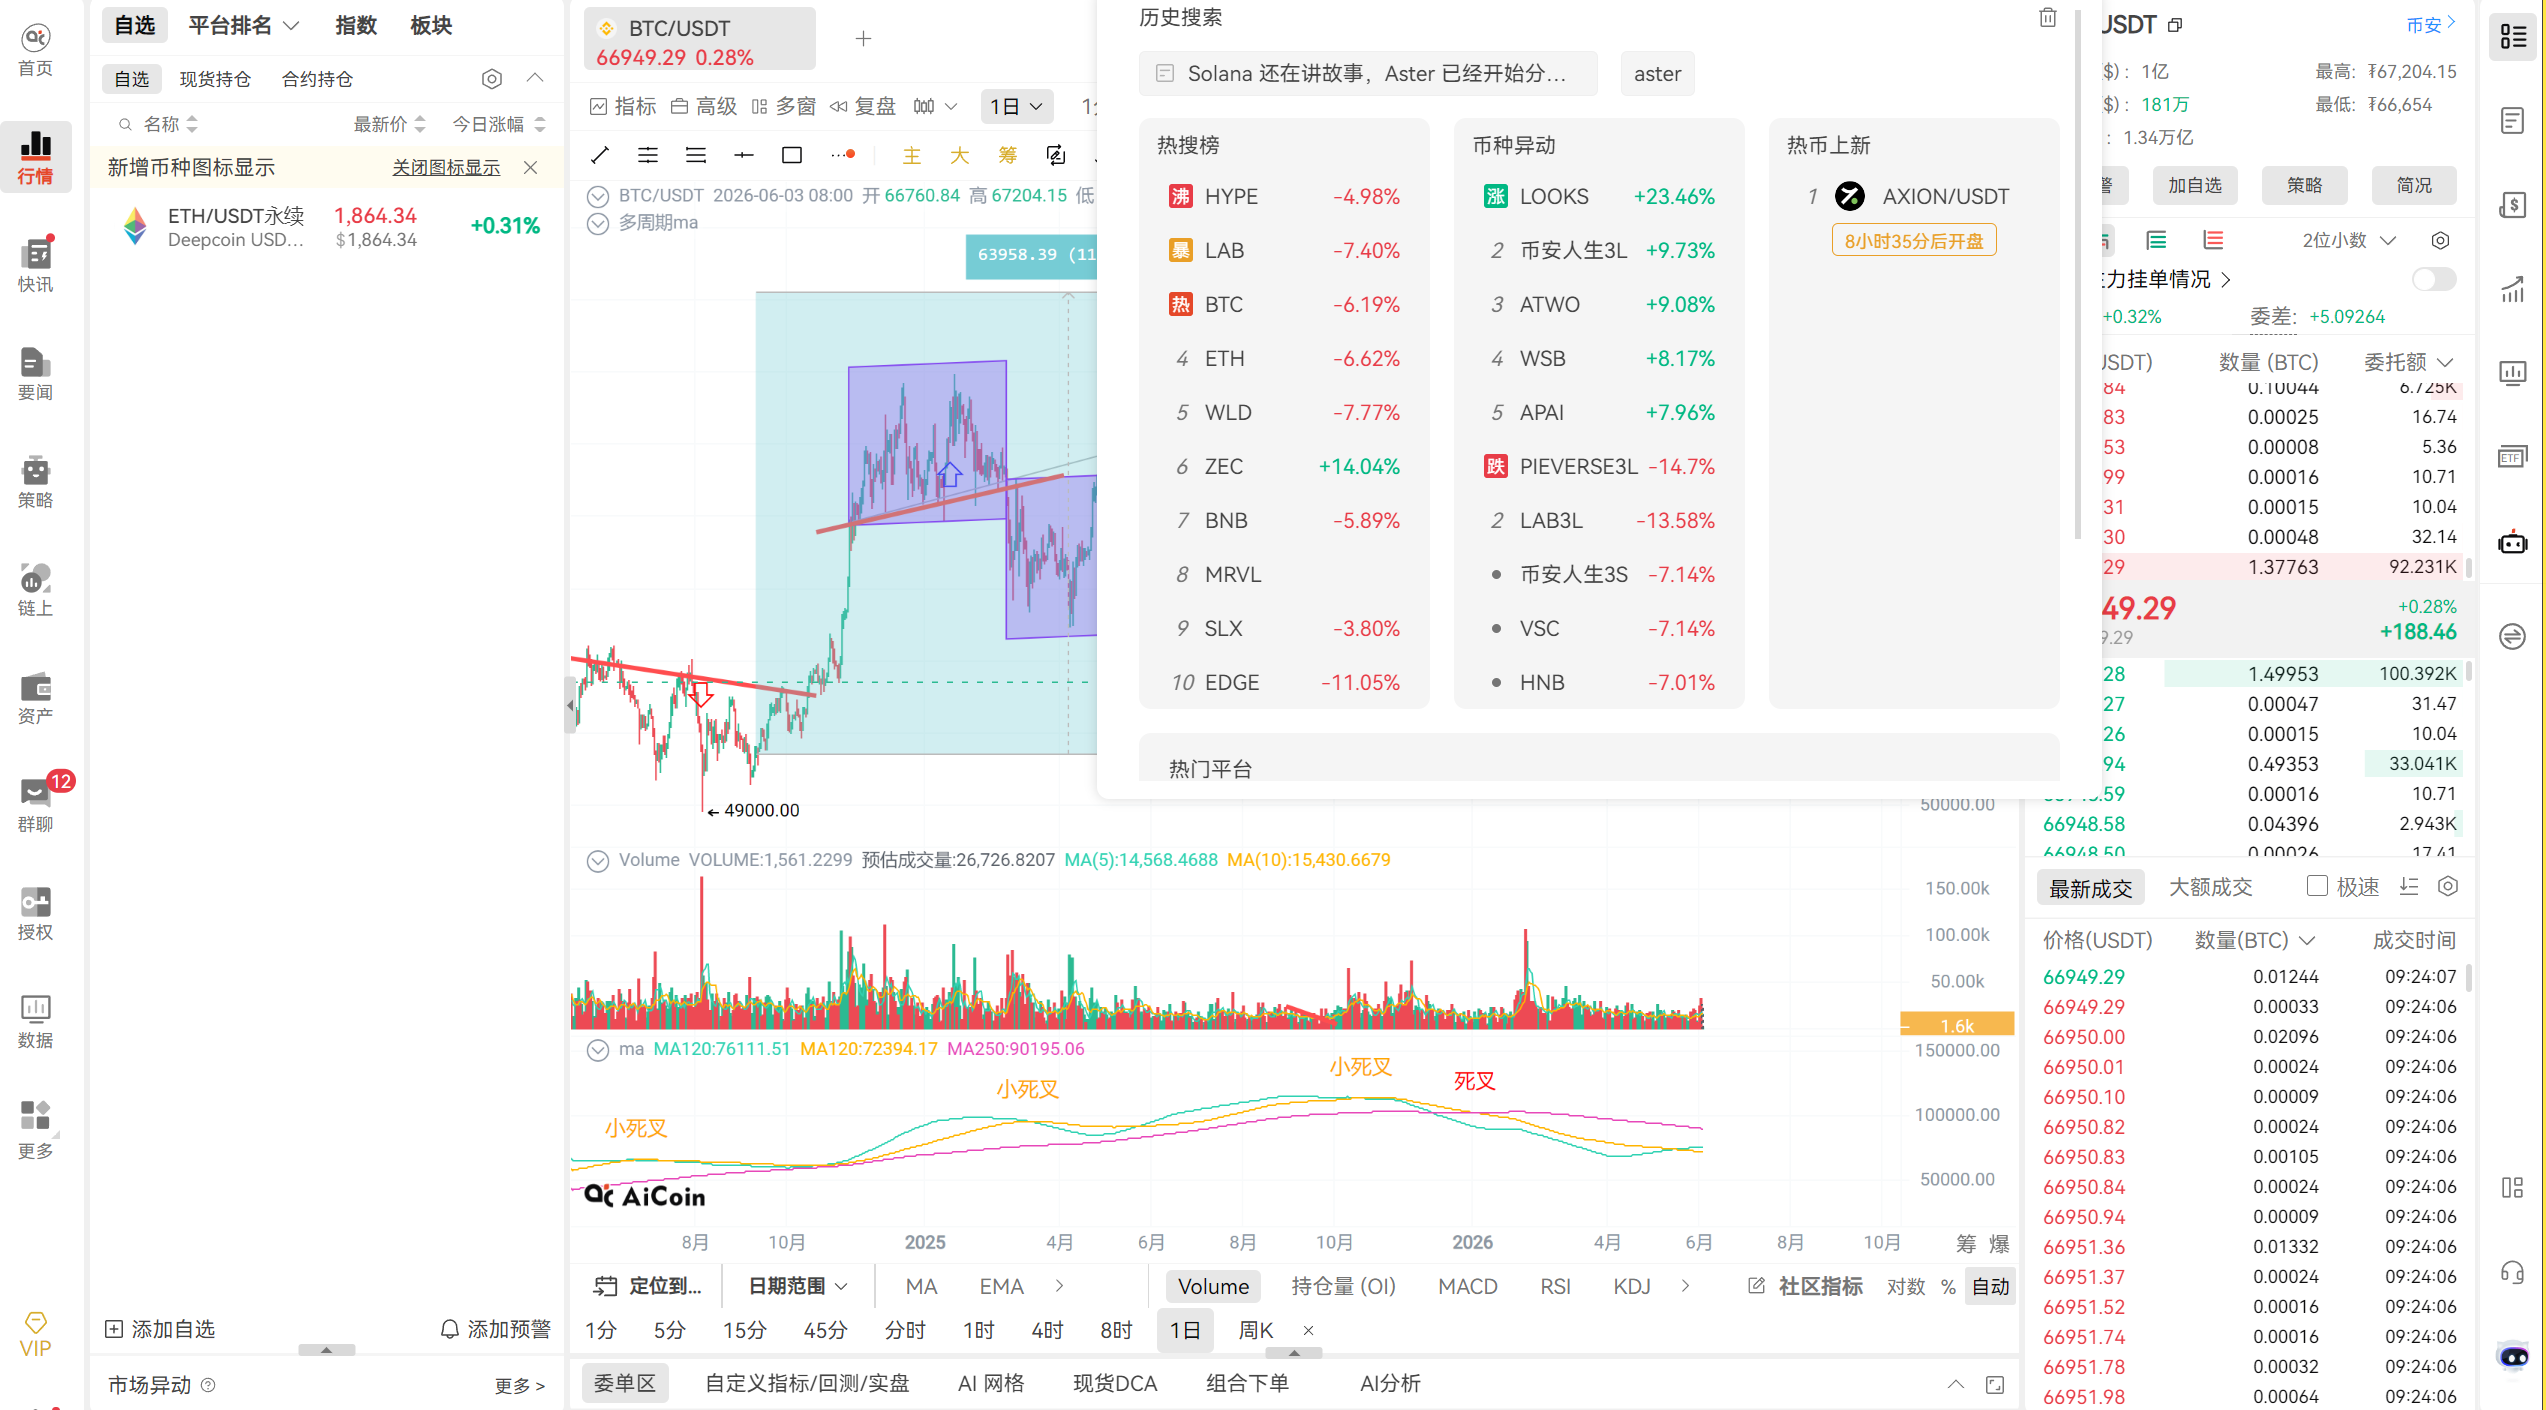
First, let me show you what this set of indicators looks like, and I also want to remind those who are longing or shorting: from the Ichimoku Cloud on the 1-hour timeframe, Bitcoin has now found support at the bottom, and it won't drop significantly in the short term. Friends who are shorting should take profit as there are many bulls waiting to buy at the bottom.


 Of course, different timeframes give different signals. Friends trading on the 4-hour level should not rush to enter the market; the bullish signal on the 4-hour timeframe has not yet been confirmed, so it’s wiser to wait patiently.
  Not just mainstream coins, the World Cup is coming soon, and the World Cup meme coins that everyone is focusing on can also be analyzed with this set of indicators. For example, you can easily find entry opportunities for the Spain meme coin traded in the OKX wallet using the Ichimoku Cloud. The World Cup is here. You can either make predictions or trade memes. Everything is in place; all that’s missing is this indicator to help you!
To kick off, let's send some benefits to everyone. Recently, the market has been very volatile, and many friends have faced liquidation and are short on capital. By using my invitation code to register for OKX, you can get a 20% fee reduction on trading World Cup memes. A little saving is still saving: 👉 Invitation Code: AICOIN88 👉 Invitation Link: https://web3.okx.com/ul/joindex?ref=AICOIN88
Alright, let’s get started officially. Now everyone follow my operations, open your market software, hide other indicators, and only search and select “Ichimoku Cloud”.
 You can find this indicator on PC, mobile app, and web. Once selected, you will find that the candlestick chart suddenly becomes clear and advanced, with all trends and signals displayed in front of you.
I won’t dwell on its definition; you can check it for yourself after the live stream. Today, we’ll purely discuss usage, introducing its core elements, so that once you learn it, you can use it directly. The most special aspect of the Ichimoku chart is that it not only looks at prices but also emphasizes the concept of “time,” predicting when the market will change direction, and roughly where the target price might reach. This is why many people say it can “lead prices.” It helps you clearly see the changing forces of buyers and sellers, and the trend judgments are unreasonably accurate.
The Core of the Core: Understanding the "Cloud" Understands Half of the Trend
The most important element of Ichimoku Cloud is that color band that looks like a cloud, and you just need to remember one word: Cloud.
 It is composed of two lines called Leading Span 1 and Leading Span 2. In some software, they are also called Leading Span A and Leading Span B. The names are different, but the content is the same, just like someone named Linda in a big city might be called Dogsheng in their rural hometown; they are essentially the same person.
The function of the cloud is very straightforward: it provides support and resistance for prices, which is the first key point of today:
- If the K-line price is above the cloud, the cloud provides support to the K-line.
- If the K-line price is below the cloud, the cloud provides resistance to the K-line.
Now returning to the BTC market I showed you at the beginning, at this time, hasn't the latest 1-hour K-line already passed through the cloud from below and stood above the cloud? So, the cloud below has become strong support, and it is difficult to break it in the short term.  Based on this characteristic of the cloud, we can derive the first basic trading strategy, which is very easy to remember:
- If the price is above the cloud, it indicates a bullish trend, focus on going long.
- If the price is below the cloud, it indicates a bearish trend, focus on shorting.
- If the price crosses the cloud from below to above, the bullish trend is established, you can enter to go long.
- If the price crosses the cloud from above to below, the bearish trend begins, you can enter to short.
- If the price is inside the cloud, it is “cloudy,” and direction is unclear, it is advised to wait and observe.
Let’s verify this by looking back at K-lines. Previously, these two waves of price dropped below the cloud, leading to smooth downward trends; using this signal to short, you could capitalize significantly (Image 8). Conversely, when the price crosses above the cloud, it marks the beginning of an upward trend, and the effect is equally evident. 
Three More Key Elements: Fast and Slow Lines and Lagging Line
In addition to the cloud, Ichimoku Cloud has three core elements, which we will discuss one by one, and they are all simple. The first is the Conversion Line, which changes very quickly along with price, hence it is commonly called the “fast line”; the second is the Base Line, which changes relatively slowly and is commonly called the “slow line.” Friends who have heard me talk about EMA and MA know that when they see the fast and slow lines, the first thing that comes to mind is to look for golden crosses and dead crosses. Yes, their crossing points are the signals for short-term trend reversals.

The last element, which I personally use the most, is the Lagging Line.
 Its role is to confirm trend reversals, and the signals are very accurate with very few false signals. Looking at the Lagging Line alone is simple:
- If the Lagging Line is above the K-line, it represents an uptrend.
- If the Lagging Line is below the K-line, it represents a downtrend.
- If the Lagging Line crosses above the K-line, it signals a buy.
- If the Lagging Line crosses below the K-line, it signals a sell.
To show you the practical effect, here the Lagging Line crosses above the K-line, after which there is a wave of upward movement; the Lagging Line has remained above the K-line, indicating that the bullish trend has been sustained; once it drops below the K-line, the bearish trend ensues.
 When I use this set of indicators, I most often use the combination of cloud + Lagging Line, while the Base Line and Conversion Line are used relatively less. This combination is also simple to use; just combine the Lagging Line and the cloud:
- If the Lagging Line is above the cloud, it indicates a bullish trend.
- If the Lagging Line is below the cloud, it indicates a bearish trend.
- If the Lagging Line crosses above the cloud, a bull market starts, buy.
- If the Lagging Line crosses below the cloud, a bear market starts, sell.
- If the Lagging Line is within the cloud, the direction is unclear, do not operate.
Let’s verify this with the movement of ETH. Previously, the Lagging Line of ETH crossed below the cloud around 2200, and afterward, it declined all the way. If you understood this signal, how could you possibly be liquidated? (Image 14) Looking further back, after the Lagging Line crossed above the cloud, it experienced a complete rise of 400 points.
 BTC is the same; after it started from the bottom, the Lagging Line never returned to the cloud, indicating that it has always been in a strong bullish trend.

Final Words
Today’s content is a bit much, and I’m afraid everyone might not be able to digest it all at once. For deeper theories of time, volatility, and levels, we will continue in the next live stream. Today, as long as you grasp these four core elements: cloud, Conversion Line, Base Line, Lagging Line, and can use them to see trends and find support and resistance, you have already gained a lot.
Finally, I’ll leave you with an assignment. Go back and study the selling conditions when these three signals resonate: the Conversion Line crosses below the Base Line, the Lagging Line is below the K-line, and the K-line drops below the cloud. When these three signals appear simultaneously, it is a very strong selling signal with a very high accuracy rate.
Ichimoku Cloud is truly an underrated treasure indicator, applicable to both mainstream coins and meme coins, whether trading short-term or mid-term. As long as you seize a big trend, you can take off directly. Everyone should go back, review historical K-lines, and practice a lot; you will quickly get the hang of it. That’s it for today’s live stream; we’ll see you next time!
Currently, there are live streams every afternoon, please lock in timely https://www.aicoin.com/zh-Hans/live/list?tab=upcoming
This article only represents the author's personal views and does not represent the stance or views of this platform. This article is for informational sharing only and does not constitute any investment advice to anyone.
免责声明:本文章仅代表作者个人观点,不代表本平台的立场和观点。本文章仅供信息分享,不构成对任何人的任何投资建议。用户与作者之间的任何争议,与本平台无关。如网页中刊载的文章或图片涉及侵权,请提供相关的权利证明和身份证明发送邮件到support@aicoin.com,本平台相关工作人员将会进行核查。