Waves in the Currency Sea: June 8 Ethereum (ETH) Market Analysis Reference:
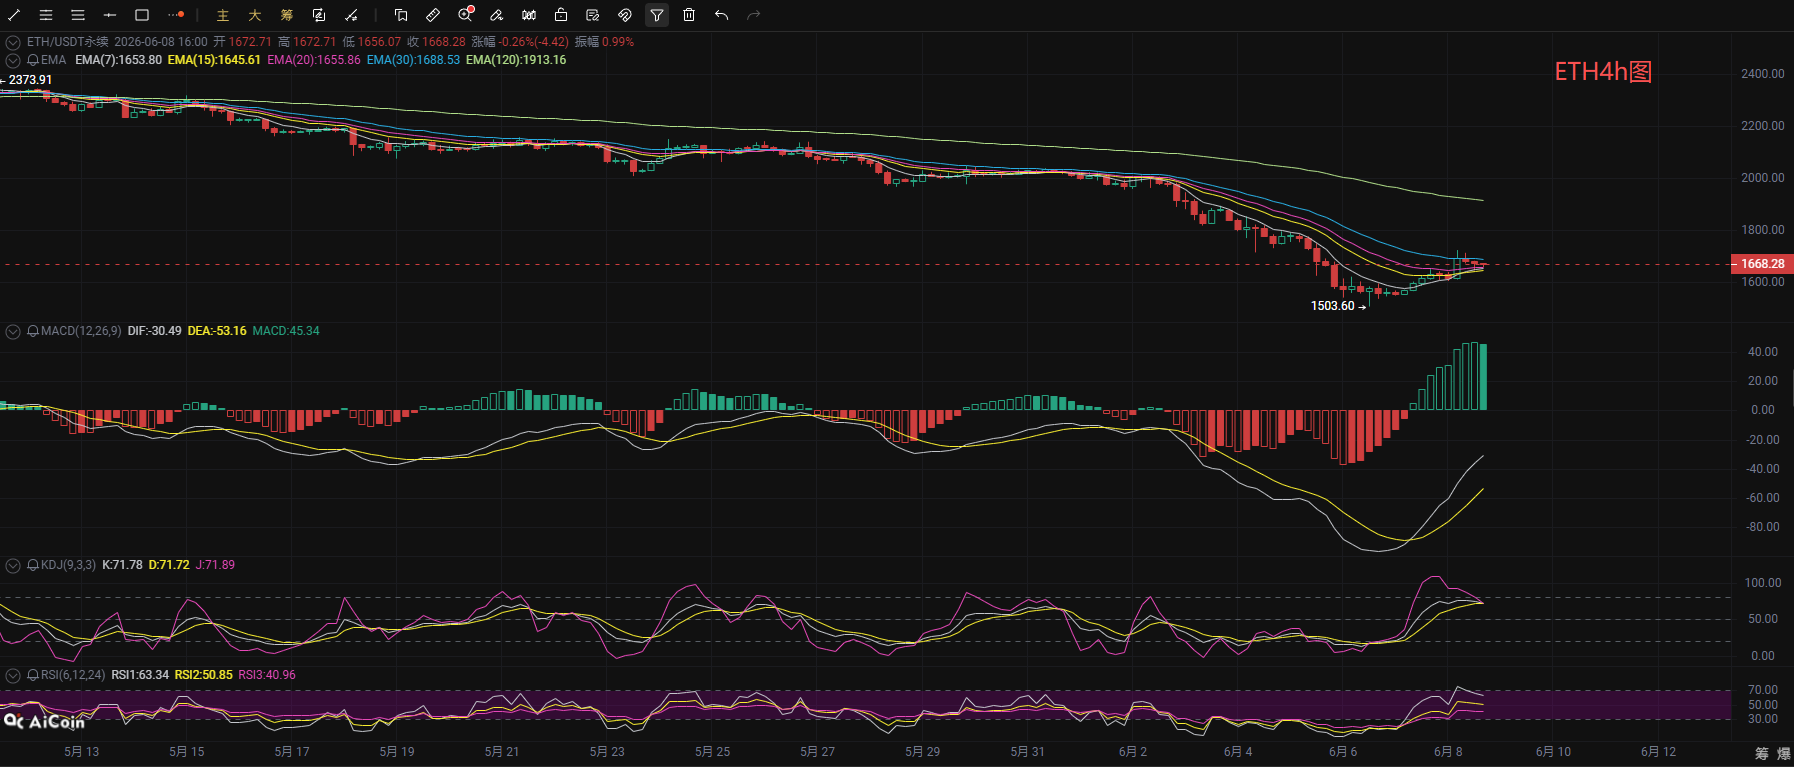
Ethereum is also experiencing a corrective trend, with the coin price stabilizing and rebounding from a low point of 1503. Currently, the price is operating between the upper and middle Bollinger Bands on a 4-hour scale, with the Bollinger Bands contracting. In the MACD indicator, the fast and slow lines are forming a golden cross at a low level and diverging upwards, with bullish momentum stabilizing. The bearish momentum during the downtrend has somewhat dissipated; however, the KDJ indicator has turned downwards at a high point but remains in a neutral-to-bullish state around 70. The RSI is concurrently retreating, and all short-term EMA moving averages (7/15/20) have turned upwards to support the coin price. However, the 30 and 120-day moving averages are still applying downward pressure from a high position, and the overall bearish trend has not reversed. This round is merely a technical rebound from an oversold condition, with the upper Bollinger Band being the primary strong resistance. A valid breakout above this resistance is needed for the rebound to continue.
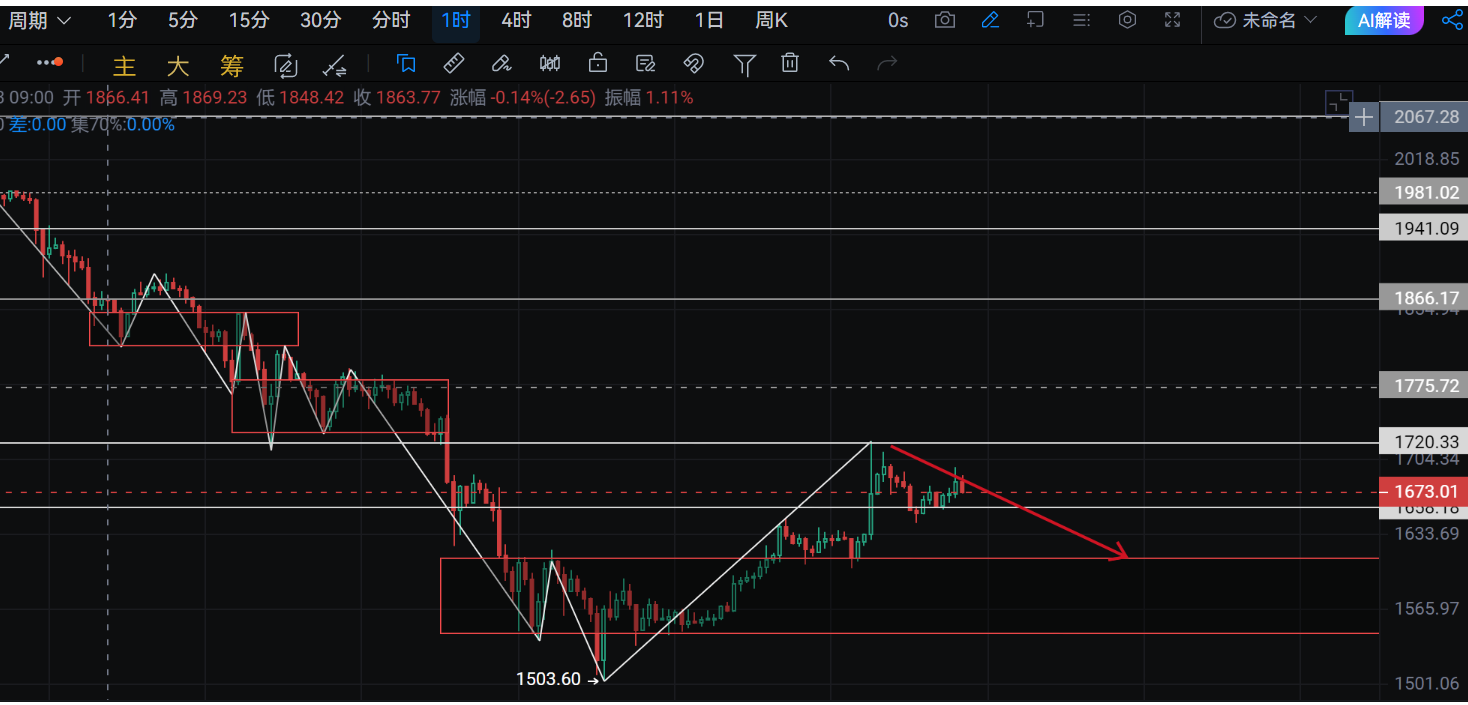
In the short-duration 1-hour scale, the price showed weak upward momentum after reaching a temporary high above 1720, moving into a sideways consolidation pattern with a slight pullback to around 1660. The MACD dual lines have formed a slight dead cross, the previous bullish volume has disappeared, and a small amount of negative volume has appeared, indicating a significant decrease in short-term upward momentum; the KDJ and RSI are both turning downwards, and the bullish strength has weakened considerably. It is expected that the short-term market will continue to consolidate sideways to absorb selling pressure from above; however, the support below is gradually rising. As long as the lower Bollinger Band support is not broken, this short-term rebound trend will not end. Conversely, if the coin price breaks down, it will continue to fall and test the low support range of the 4-hour scale.
Waves in the Currency Sea: June 8 Ethereum Short-Term Reference:
Short Position: Selling in the range of 1750-1710, with a stop at 1840, targeting 1700-1650,
Long Position: Buying in the range of 1600-1630, with a stop loss of 30 points, targeting 1660-1710,
[The above analysis and strategy are for reference only. Please bear the risk yourself. There may be delays in article review and publication, and the strategies may lack timeliness. Do not operate blindly.]

The content of this article is originally shared by 【Waves in the Currency Sea】 and represents personal views only. There may be delays in article distribution; it is for reference only. Do not operate blindly! If you want to get more daily real-time signals? Then follow my public account! Here you can have online technical learning of the market and learn about knowledge related to exiting positions. I have years of research experience in the market, focusing on the major trends in the cryptocurrency circle, mainly responsible for analyzing and guiding investment operations for BTC, ETH, SOL, BCH, and other coins. Welcome to study together.
免责声明:本文章仅代表作者个人观点,不代表本平台的立场和观点。本文章仅供信息分享,不构成对任何人的任何投资建议。用户与作者之间的任何争议,与本平台无关。如网页中刊载的文章或图片涉及侵权,请提供相关的权利证明和身份证明发送邮件到support@aicoin.com,本平台相关工作人员将会进行核查。