Dear friends, I am Sister Qinglan. Today's market news is very complex, but there are two things worth focusing on. Firstly, the South Korean stock market has collapsed, with the South Korean composite index plummeting 8%, triggering a circuit breaker, foreign capital withdrawing on a large scale, and retail investors being wrecked by leverage. This has directly led to a global sell-off of risk assets, with BTC also facing downward pressure. Secondly, the escalation of geopolitical conflicts, the tension between Iran and Israel has pushed oil prices higher, with both WTI and Brent crude oil rising more than $4 in a day, increasing risk-averse sentiment, which has temporarily suppressed BTC and other risk assets. These two major bearish factors have created extreme fear in the market, with the Fear and Greed Index dropping to 12, a historical low. However, we have also seen some short-term positives, such as Trump claiming he would decide on the Iran agreement and asking Israel not to retaliate, which has raised expectations for geopolitical easing and pushed BTC to rebound briefly above $64,000. Whether this rebound can continue still needs confirmation from technical analysis.
Current Price and Time
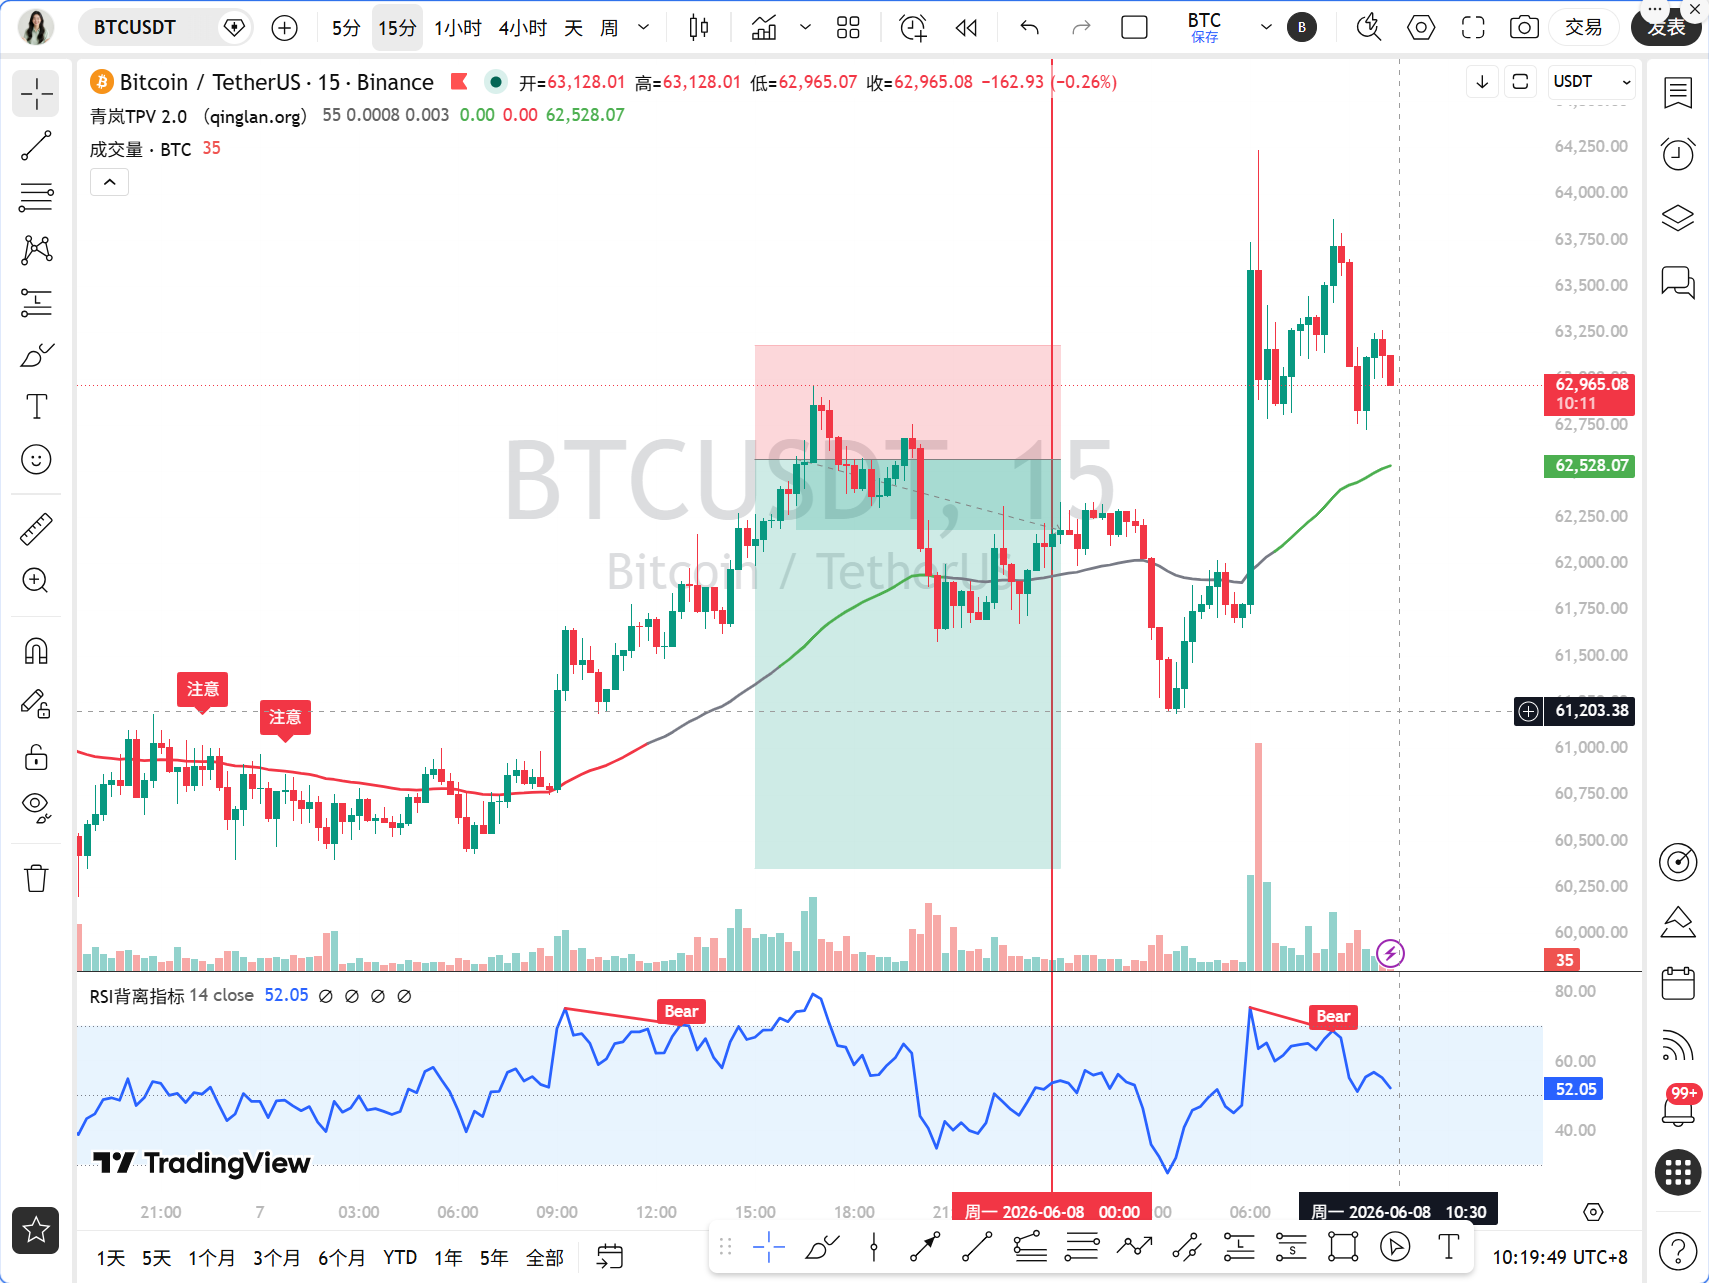
The current time is June 8, 10:22, and the BTC price is 63,074 USDT. After experiencing a rapid rise, the price is currently in a state of consolidation, with intense long and short competition.
Multi-timeframe Overview
First, let's look at the daily level. The daily MA5=62,446, MA10=66,210, MA30=73,827, and the moving averages show a bearish arrangement, with the price operating below the MA5, and short-term rebounds being suppressed. In terms of MACD, DIF=-4,029, DEA=-2,949, and the bar value is -1,079, indicating that bearish momentum is still being released, but the bar value has narrowed compared to the previous day, showing a slowdown in the rate of decline. RSI=14.36, has entered the oversold zone, and historically, such extreme values often indicate an increased probability of a short-term rebound, but a trend reversal will still take time.
4-hour level. The 4-hour MA5=62,489, MA10=61,882, MA30=62,760, with the price standing above MA5 and MA10, and short-term moving averages starting to flatten, showing signs of a golden cross formation. In terms of MACD, DIF=-899, DEA=-1,453, and the bar value is 553, with bearish momentum bars continuously shortening, and DIF and DEA about to form a golden cross, which is a signal for a short-term rebound. RSI=68.67, close to the neutral strong area, indicating that the rebound strength is increasing.
1-hour level. The 1-hour MA5=63,222, MA10=62,528, MA30=62,038, with the price oscillating between MA5 and MA10, and the moving average system starting to merge. In terms of MACD, DIF=412, DEA=303, and the bar value is 108, with bullish momentum bars shortening, indicating a reduction in short-term upward momentum. RSI=62.83, is in the neutral zone, with no obvious overbought or oversold conditions. EMA55=61,997, and the current price of 63,074 is about 1.74% above EMA55, indicating a bullish trend area.
15-minute level. The 15-minute MA5=63,071, MA10=63,251, MA30=62,597, with the price running below MA5 and MA10, and short-term moving averages forming a dead cross, indicating a pullback pressure. In terms of MACD, DIF=242, DEA=294, and the bar value is -52, with bearish momentum bars appearing, indicating a short-term pullback demand. RSI=54.25, is in the neutral weak area.
TPV Signal Validation
According to the Qinglan TPV system, we use the 1-hour EMA55 as the dividing line between long and short. The current price is 63,074, which is above the EMA55 of 61,997, indicating a bullish trend area. However, we need to verify whether the conditions for going long are met.
First, let's look at the first condition, which is that the price must stabilize above the 1-hour EMA55. In the last 8 1-hour candlesticks, the closing price was above EMA55 on 5 occasions, and there was 1 crossover. The current price is 1.74% away from EMA55, which does not meet the oscillation threshold, indicating a possible unilateral trend. However, the condition of the last two consecutive 1-hour candlesticks closing above EMA55 is currently met, with the latest two candlesticks closing at 63,074 and 62,980, both above EMA55.
The second condition is that support must stabilize. From the 1-hour chart, after the price hit a low around 61,500 near 22:00 on June 7, a long lower shadow appeared, followed by a rebound, forming a bottoming structure, which signals stabilized support. At the same time, trading volume increased during the rebound process, indicating that funds came in.
The third condition is that the bearish momentum must weaken. In terms of MACD, the 1-hour MACD bar value has been shortening since the negative area around 22:00 on June 7, and has now turned positive, with multiple cycles of shortening, indicating that bearish momentum has weakened. RSI has risen from below 30 to 62, further validating the increase in rebound momentum.
Overall, all three conditions for going long are met, and the system gives a bullish signal. However, it should be noted that a pullback signal has appeared at the 15-minute level, indicating a possible short-term demand for a retest.
On-chain / Funding Aspect
In terms of on-chain data, the Fear and Greed Index is at 12, indicating extreme fear, which historically corresponds to short-term bottom areas. The 24-hour BTC price fluctuation is 4.02%, indicating strong rebound strength. The BTC market share is 56.13%, which is at a high level, indicating that funds are seeking refuge in BTC while altcoins are performing weakly.
Regarding funding, the collapse of the South Korean stock market has led to foreign capital withdrawals and tightening liquidity, which puts pressure on BTC. The U.S. Treasury plans to raise the TGA balance to $1 trillion by the end of July, which will drain market liquidity, negatively impacting risk assets. Goldman Sachs no longer bets on an interest rate cut this year due to strong employment, and the strong dollar also puts liquidity pressure on BTC. However, Strategy CEO clarified that increasing BTC holdings is a long-term strategy, and Jiang Zhuoer stated that Strategy would not significantly sell coins, which alleviated market concerns about large holders dumping assets.
Key Attack and Defense Levels
The first resistance level above is at 64,000, which was a previous rebound highpoint and also a psychological barrier. If broken, the next resistance level is at 65,000, near the 4-hour MA30. The first support level below is at 62,000, which is near the 1-hour EMA55 and also the starting point of the recent rebound. If broken, the next support level is at 61,500, which is the previous low and also the last defense line for the bulls.
Trading Strategy
Based on the bullish signal from the Qinglan TPV system, together with the current market environment, I propose the following trading approach.
Direction: Go long.
Entry Condition: Wait for the price to pull back to the area near the 1-hour EMA55, in the range of 62,000-62,200, with a long lower shadow or a bottom structure appearing, while the MACD bar value shortens again, and the RSI returns to around 50, after which you can enter in batches. If the price directly breaks and stabilizes above 64,000, you can also chase the long position, but the position size should be light.
Stop Loss Level: Set below 61,500, which is below the previous low. If broken, it indicates the failure of the bulls, necessitating an exit.
Target Levels: The first target level is 64,000, the second target level is 65,000, and the third target level is 66,000. If the price appears to have a top structure or a long upper shadow near 64,000, consider reducing positions or taking profits.
Risk Warning
Bearish factors such as geopolitical conflicts and the collapse of the South Korean stock market are still fermenting, and the rebound may only be a short-term behavior. Be cautious with position sizes and avoid chasing high.
Follow Qinglan's Crypto Classroom to grasp more trading opportunities together! Welcome to visit the official website www.qinglan.org
📊 Qinglan TPV Trading Strategy Backtesting Reference
🕒 Last backtesting time June 8, 07:00:01
Total Analysis: 2,098 Backtesting: 1,676 Accuracy Rate: 68.4% (1,146/1,676)
免责声明:本文章仅代表作者个人观点,不代表本平台的立场和观点。本文章仅供信息分享,不构成对任何人的任何投资建议。用户与作者之间的任何争议,与本平台无关。如网页中刊载的文章或图片涉及侵权,请提供相关的权利证明和身份证明发送邮件到support@aicoin.com,本平台相关工作人员将会进行核查。