Cryptocurrency Expert: Is Bitcoin at a Short-Term Bottom at 68 or is it a Downtrend Continuation? The Answer is Here! Latest Market Analysis and Trading Suggestions
The current price of Bitcoin is 61888. Why has it fallen so sharply? The cryptocurrency market has always been about high expectations; when emotions retreat, it leads to selling. From the ETF frenzy to continuous capital outflows, from the weakening narrative of digital gold to panic selling, each step is driven by human nature. FOMO in buying high, gambling without stop-losses, and heavily investing all-in, these three pitfalls have been experienced by 90% of people. Bitcoin is not a god; it is a high-risk asset, and volatility is the norm. Listen less to rumors, be less swayed by emotions; you are in charge of your trades, and you must accept both profits and losses.
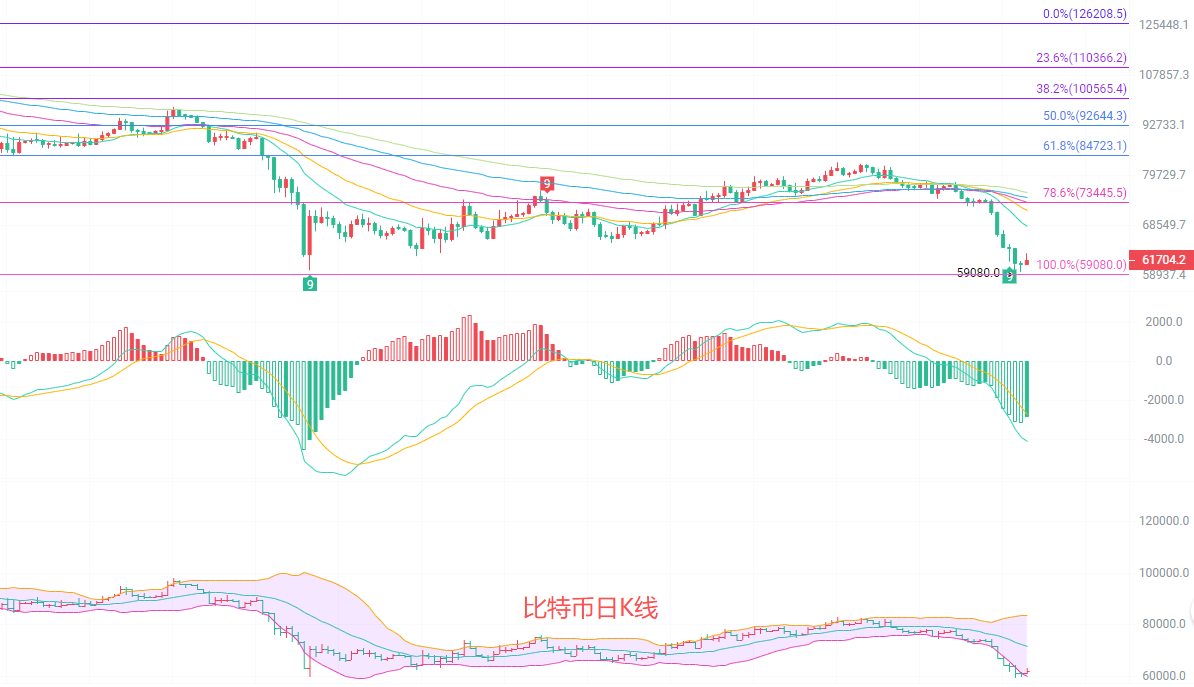
The daily candlestick chart is in a clear downtrend. The price has broken below all moving averages including EMA15, EMA30, and EMA60, forming a downward arrangement, with upper moving averages applying pressure. The MACD indicator continues to decline below the zero line, with the green bars constantly enlarging, showing ample downward momentum. The Bollinger Bands are opening downward, the price has fallen below the lower band, indicating an oversold state, but there has not yet been a signal to stop the decline. According to Fibonacci, the price has breached the support at 73445, with strong support located at 59080 below. If this level is broken, new downward space will be opened, and the short-term trend remains bearish, with rebounds likely being a trap for bulls.
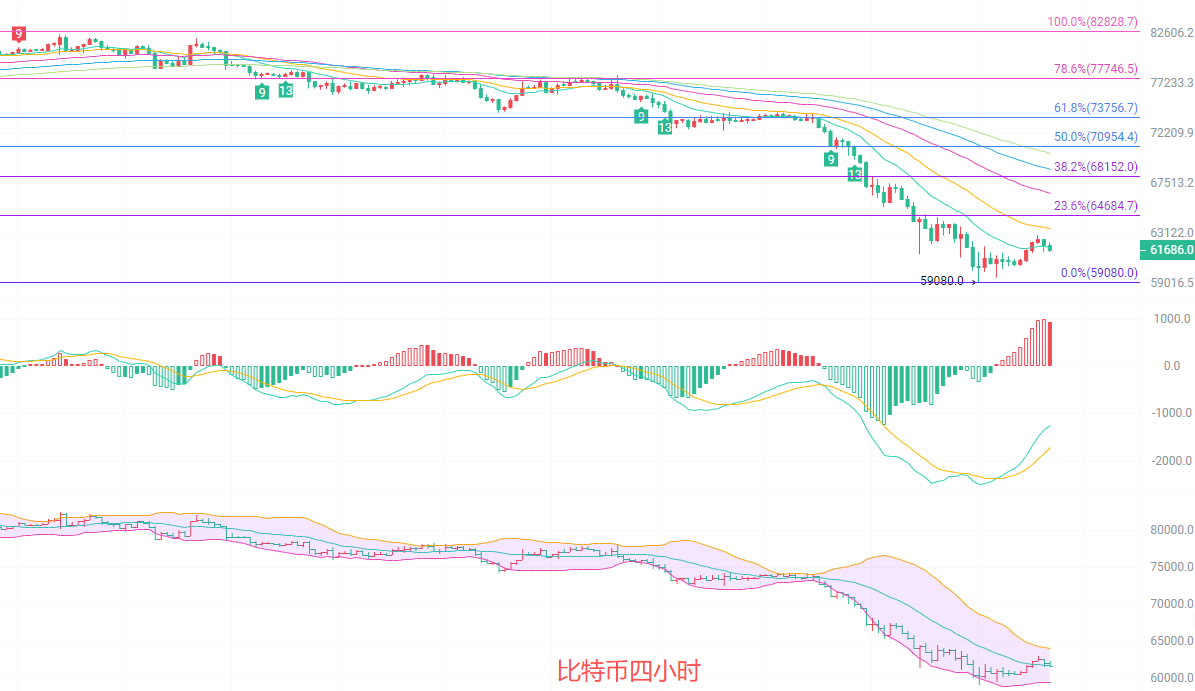
The four-hour candlestick chart is currently in a phase of oversold rebound. The MACD shows a bottom divergence, with the green bars shortening, and the DIF turning upward, indicating a short-term need for repair. The lower band of the Bollinger Bands provides support around 59484, while the price is currently operating below the lower band, and the rebound is constrained by the middle band at 64105. The EMA moving averages are arranged downward, indicating that the price is still under pressure from EMA15 and EMA30, showing that the rebound is merely a correction within the downtrend, not a reversal of the trend. Fibonacci indicates that the key resistance level for the rebound is at 64684; if this level cannot be broken, the price is likely to continue downwards testing the 59080 support.
Short-term trading strategy reference: align with the major cycle trend, quick entries and exits with small stop-losses.
Buying between 59000 and 58500, with a stop-loss at 58000 and targets from 60000 to 61500.
Selling between 63000 and 63500, with a stop-loss at 64000 and targets from 61500 to 60000.
Specific operations should be based on real-time market data. For more information, please consult the author. The article may have delayed publication; views are for reference only at your own risk.

Friendly Reminder: The content above is only created by the author's public account; advertisements at the end of the article and in the comment section are not related to the author, please discern cautiously. Thank you for reading.
免责声明:本文章仅代表作者个人观点,不代表本平台的立场和观点。本文章仅供信息分享,不构成对任何人的任何投资建议。用户与作者之间的任何争议,与本平台无关。如网页中刊载的文章或图片涉及侵权,请提供相关的权利证明和身份证明发送邮件到support@aicoin.com,本平台相关工作人员将会进行核查。