Dear friends, I am Sister Qinglan. This morning when I opened the market, I indeed felt a bit heavy-hearted. Last night’s non-farm payroll data exceeded expectations, directly pushing up interest rate hike expectations, causing BTC to fall below the 60,000 US dollar mark, and ETH to drop below 1,600 US dollars. Meanwhile, US stock chip stocks evaporated 1.3 trillion US dollars in market value in a single day, with the Philadelphia Semiconductor Index recording the largest drop since the pandemic, and panic sentiment has spread from traditional markets to the crypto market. In the past 24 hours, the entire network experienced liquidations of 1.829 billion US dollars, with over 340,000 people liquidated. Such a level of clearance is also rare in history. The market is currently in a state of extreme panic, with the Fear and Greed Index at only 12, but the more we are in such times, the more we need to calmly analyze data instead of being led by emotions.
Current Price and Time
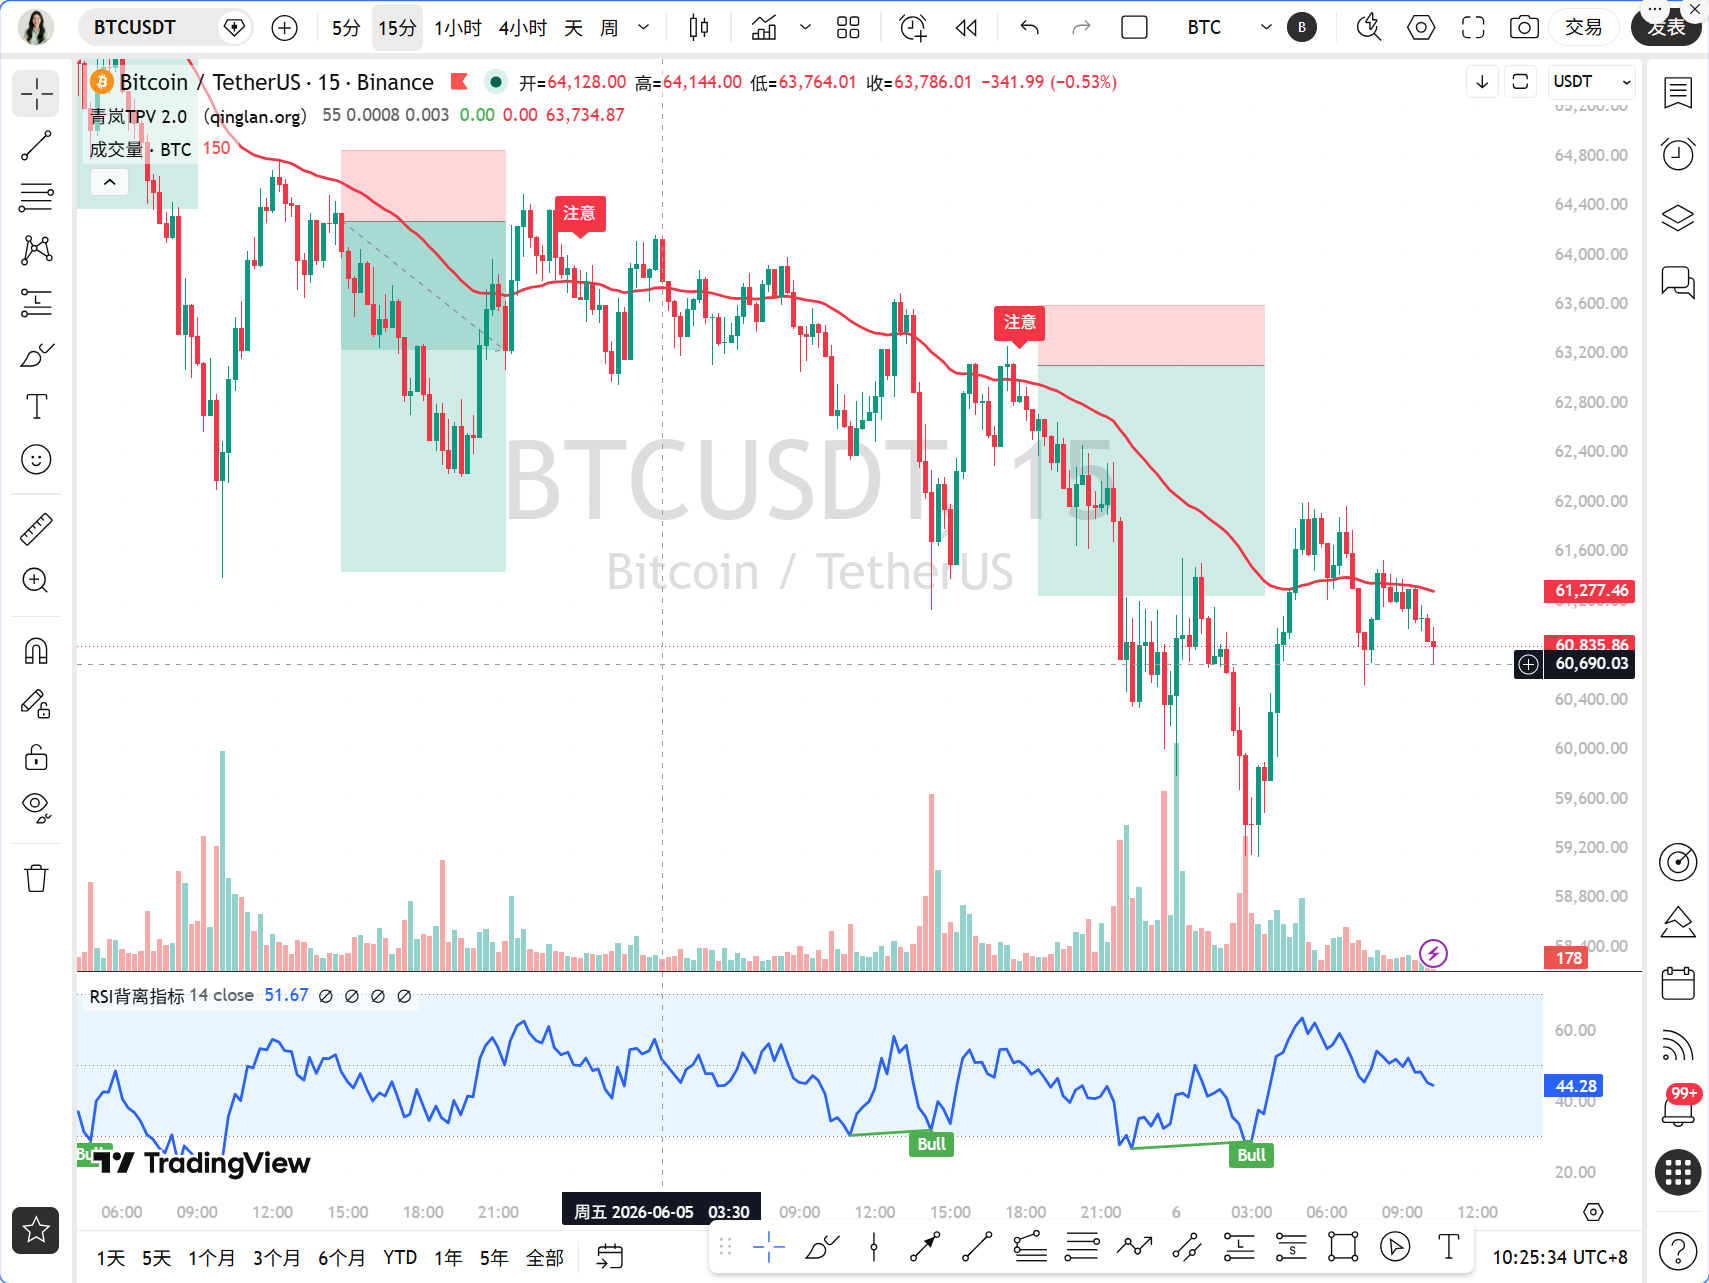
The current time is June 6th, 10:26 AM, and BTC is priced at 60,863 USDT. This position is only a step away from the 60,000 figure we previously focused on, but it has already broken multiple key support levels. We need to let data speak and see the real status across various timeframes.
Multi-Timeframe Status Overview
First, let’s look at the daily chart, which sets the tone for the larger cycle. The daily MA5 is at 63,341, MA10 at 68,275, and MA30 at 74,975, with the price of 60,863 far below all moving averages, indicating a typical bear arrangement. The MACD’s DIF is -3,909, DEA is -2,356, and the histogram is -1,553, with the green bars still expanding, indicating that bear momentum has not faded. The RSI is only 5.56, which has entered an extremely oversold area; historically, the RSI has rarely been below 10, with the last occurrence back at the bottom of the major bear market in 2022. At the daily level, the bearish trend is clear, but the oversold signals suggest that a technical rebound may occur at any time.
Now let’s examine the 4-hour chart. The 4-hour MA5 is at 60,924, MA10 at 62,188, and MA30 at 65,985, with the price struggling near the MA5 but far below MA10 and MA30. The MACD’s DIF is -2,427, DEA is -2,375, and the histogram is -52; although the green bars are still present, they are shorter compared to the previous one, indicating that the bearish momentum at the 4-hour level has weakened. The RSI is at 28.18, in the oversold area, but not at extreme values. At the 4-hour level, the bearish trend continues, but the speed of decline is slowing.
The 1-hour level is the core timeframe of Qinglan's TPV system. The 1-hour MA5 is at 61,167, MA10 at 60,963, and MA30 at 61,963, with the price oscillating between MA5 and MA10. The MACD’s DIF is -523, DEA is -614, and the histogram is 90.95; the red bars are expanding, indicating that there is rebound momentum at the 1-hour level. The RSI is at 43.36, in a slightly weak neutral zone. The EMA55 is at 62,807, and the current price of 60,863 is far below the EMA55, with a gap of 3.10%, indicating a unilateral bearish trend.
At the 15-minute level, MA5 is at 61,029, MA10 at 61,150, and MA30 at 61,094, with the price entangled near the moving averages. The MACD’s DIF is -23, DEA is 34, and the histogram is -58, with the green bars shortening, indicating that bearish momentum at the 15-minute level is weakening. The RSI is 34.99, approaching the oversold area.
TPV Signal Verification
Now we will use Qinglan's TPV system to verify the signals. First, let’s look at trend positioning; the current price of 60,863 is far below the 1-hour EMA55 of 62,807, so it is clearly in the bearish trend area. Oscillation auxiliary data shows that among the past 8 1-hour candles, the number of close prices greater than EMA55 is 0, the crossing count is 0, and the price is 3.10% away from EMA55, not meeting the oscillation threshold, belonging to a unilateral bearish trend.
For shorting conditions, first, the price is under pressure below the 1-hour EMA55, with two consecutive 1-hour candles closing below EMA55, this condition is met. Second, there is resistance; last night the price formed a long upper shadow near 62,000 and then quickly fell back, which is a typical top reversal meeting resistance pattern. Third, weakness in rebound; although the 1-hour MACD histogram shows expanding red bars, the RSI rose from 43 to 43.36 and then fell back again, indicating the rebound strength is very weak. With all three conditions met, the bearish signal is valid.
For long conditions, first, the price has not stabilized above EMA55, so this condition is not met. Second, there is no clear long lower shadow or bottom reversal pattern seen yet. Third, the bearish momentum has not exhausted; the daily and 4-hour MACD green bars are still expanding, and only the 1-hour and 15-minute levels show signs of exhaustion, but they are too small to form a reversal signal. Therefore, the long conditions do not hold.
On-Chain Funding View
From the on-chain data, the Fear and Greed Index is 12, indicating extreme fear; historically, this position often corresponds to a stage bottom, but a short-term rebound requires time. The BTC market share is 56.07%, indicating that funds are flowing from altcoins to Bitcoin, but Bitcoin itself is also falling, showing that the overall market is deleveraging. The liquidations in the past 24 hours reached 1.829 billion US dollars, which is a frightening figure, but liquidations often mean short-term selling pressure has been released, and subsequent selling power will weaken. The risk of liquidation for large whales in ETH still exists, as 343,000 ETH face 547 million US dollars in liquidation, which continuously pressures ETH.
Key Attack and Defense Levels
The most critical position is the 60,000 psychological threshold, which serves as both psychological and technical support. If it falls below 60,000, the next support is around 58,000, which is the starting point from October last year. The upper pressure level is at 62,000, which is the high point of last night's rebound and is also near the 1-hour EMA55 area. If the price rebounds to around 62,000, it will again face bearish pressure. The higher pressure lies at 64,000, which is the position of the 4-hour MA10.
Trading Thoughts
Based on the Qinglan TPV system, we are currently in a unilateral bearish trend; our trading thoughts are mainly focused on shorting, but we must be cautious of rebound risks after being oversold.
Direction: Short. Entry conditions: Wait for the price to rebound to the range of 61,500-62,000 and see a long upper shadow or top reversal pattern at the 1-hour level while MACD red bars shorten and RSI rises from the oversold area back to around 50 and then turns down again. This is a signal to confirm the continuation of bearish momentum. Set the stop-loss at 62,500; if the price breaks the 1-hour EMA55 and stabilizes, it indicates that the bearish trend may change, and we need to exit the position. The first target is 60,000, and the second target is 58,000. If the price directly falls below 60,000, it is not recommended to chase shorts as the 60,000 threshold may have fluctuations; waiting for confirmation of the rebound before entering is safer.
If there is clear support around 60,000, such as a bottom reversal pattern at the 15-minute or 1-hour level, while MACD green bars continuously shorten and RSI recovers from the oversold area, we can consider taking a small long position, but it should only be for a short-term rebound, with the target at 61,000-61,500 and stop-loss set at 59,500. Note that this is a counter-trend trade, so the position should be light and strict stop-loss should be observed.
Risk Warning
The current market is in extreme panic, liquidity is exhausted, any technical analysis may fail; please strictly control your position and do not hold onto losing trades.
Follow the Qinglan Crypto Classroom to seize more trading opportunities! Welcome to visit the official website www.qinglan.org
📊 Qinglan TPV Trading Strategy Backtesting Reference
🕒 Last Backtest Time 06-06 07:00:01
Total Analysis: 2053 Backtest: 1657 Accuracy Rate: 68% (1127/1657)
免责声明:本文章仅代表作者个人观点,不代表本平台的立场和观点。本文章仅供信息分享,不构成对任何人的任何投资建议。用户与作者之间的任何争议,与本平台无关。如网页中刊载的文章或图片涉及侵权,请提供相关的权利证明和身份证明发送邮件到support@aicoin.com,本平台相关工作人员将会进行核查。


