Cryptocurrency Circle Academician: The downward pattern of Ethereum's daily line at 6.5 is hard to change. How much short-term rebound space does Ethereum have left? Latest market analysis and trading suggestions
Ethereum's current price is 1775. The short-term small uptrend is just a recovery from overselling. The downward pressure in the 4-hour and daily main cycles still exists, so don't be misled by a temporary rebound. Follow the overall trend, shorting with a clear direction has a much higher tolerance than trying to go long against the trend. Short-term long positions are only suitable for small accounts and quick trades. Many people lose money because they cannot control their hands; they frequently enter trades whenever the market fluctuates, and frequent trading will only accumulate losses. Remember, in a downward trend, being patient and watching from the sidelines can also be profitable. Preserve your capital and wait for certain opportunities before taking action.
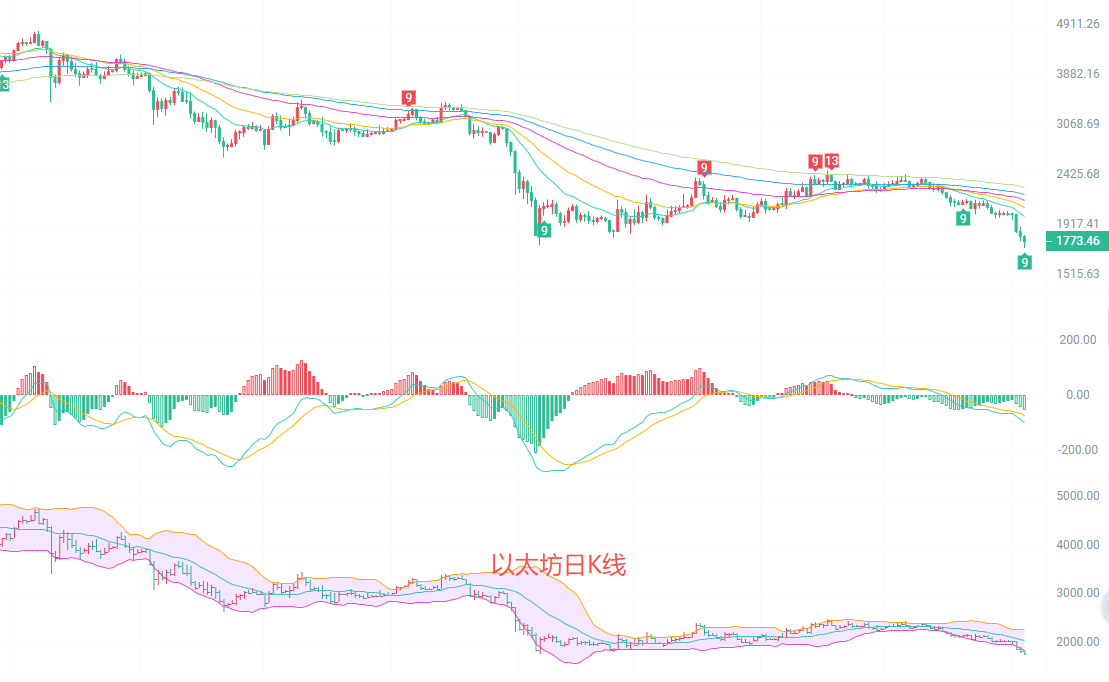
The daily K-line reached a low of 1712, creating a new low for this phase. The moving average system is all aligned downwards, the daily moving averages are pressing the price layer by layer from top to bottom, and the Bollinger Bands are opening downwards. The coin price is firmly stuck below the lower Bollinger Band at 1824. The MACD indicator's DIF and DEA lines continue to decline, the green bars are expanding, maintaining downward momentum, and there are no signals indicating a stop in the downward trend on the daily line. The key resistance level above is located at the daily middle track of 2040. For a short-term upward reversal in the market, it must hold above this moving average level. Currently, the daily trend is clearly bearish.
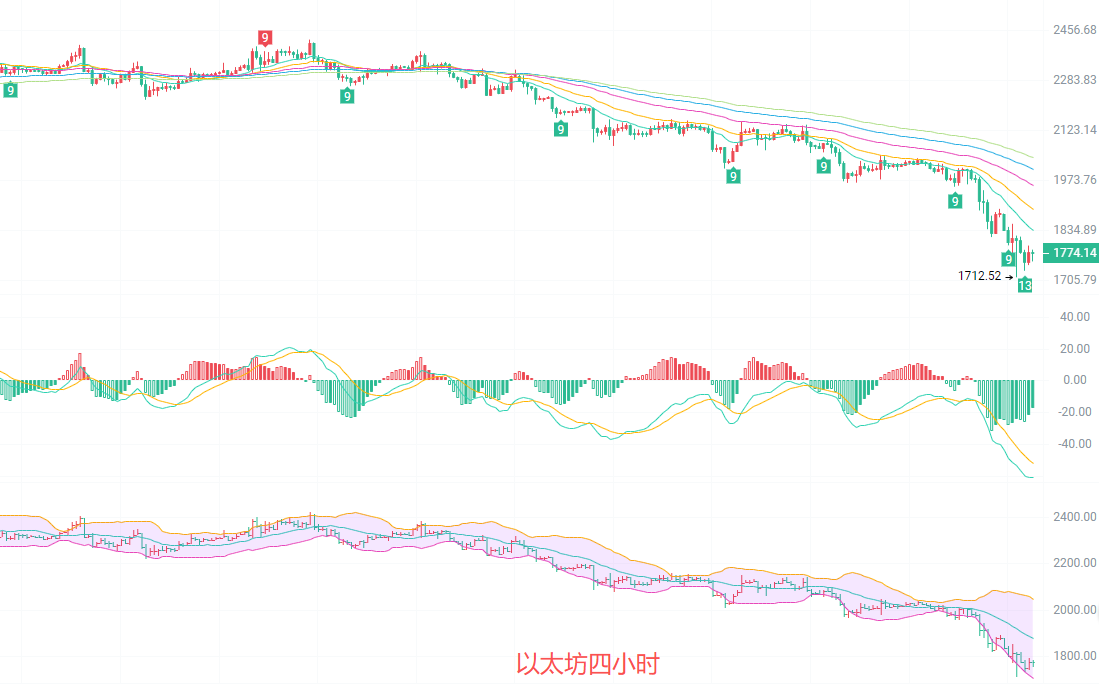
The 4-hour K-line shows a slight stop in decline with a small upward bar, but the overall downward channel has not changed. Each cycle's EMA moving averages continue to exert downward pressure, with the 15-period moving average at 1835 and the 30-period moving average at 1893 creating two nearby strong resistance levels. The Bollinger Bands continue to open, and the price is oscillating between the lower Bollinger Band at 1706 and the middle track at 1877. The MACD indicator shows DIF surpassing DEA, and the green bars are slightly reduced, indicating signs of a short-term oversold rebound, which is merely a technical recovery after a decline. The 4-hour rebound is likely a trap for bulls. After hitting the short-term moving averages, it is highly probable that it will face downward pressure again, and the large cycle's downward trend remains unchanged.
Short-term reference:
Sell south from 1830 to 1860, stop loss at 1890, target looking at 1780 to 1730
Buy north from 1730 to 1700, stop loss at 1670, target looking at 1770 to 1820
Specific operations should be based on real-time market data. More detailed information can be consulted with the writer. The publication of the article is delayed, suggestions are for reference only, and risks are to be borne by yourself.

Warm reminder: The above content is created by the author of this public account. Advertisements at the end of the article and in the comments section are unrelated to the author. Please be cautious in discerning them. Thank you for reading.
免责声明:本文章仅代表作者个人观点,不代表本平台的立场和观点。本文章仅供信息分享,不构成对任何人的任何投资建议。用户与作者之间的任何争议,与本平台无关。如网页中刊载的文章或图片涉及侵权,请提供相关的权利证明和身份证明发送邮件到support@aicoin.com,本平台相关工作人员将会进行核查。