Bitcoin fell to 61329 around ten o'clock in the morning on June 4, continuing to lose ground from yesterday's high of 66000, marking a new low in nearly 14 days, with a 24-hour decline of 7.11%. Ethereum also fell, with a current price of 1743 at the time of writing, a 24-hour drop of 7.28%, and the recent high of 2147 has become a distant memory.
In the past two days, multiple negative news have simultaneously triggered the cryptocurrency market. The US Bitcoin Spot ETF had a net outflow of 519 million dollars on June 2, with BlackRock as the main seller, indicating a clear signal of institutional reduction. Saylor sold 32 Bitcoin for the first time in four years; although the amount is not large, its symbolic significance is substantial, triggering a strong emotional response in the market.
Meanwhile, tensions have risen again in the US-Iran geopolitical disputes, increasing oil prices and safe-haven demand, further suppressing cryptocurrencies and other risk assets. The probability of the Federal Reserve raising interest rates by one basis point before the end of the year has risen to 58%, and the yield on 10-year US treasuries has climbed to 4.69%, putting widespread pressure on risk asset valuations.
Looking ahead, key points to watch include whether the yield on 10-year US treasuries can peak and decline, whether the US-Iran situation will cool down, and whether Bitcoin can gain effective support at the round number of 61000 dollars. If it fails to hold, the next technical support may see lower positions.
Bitcoin four-hour chart
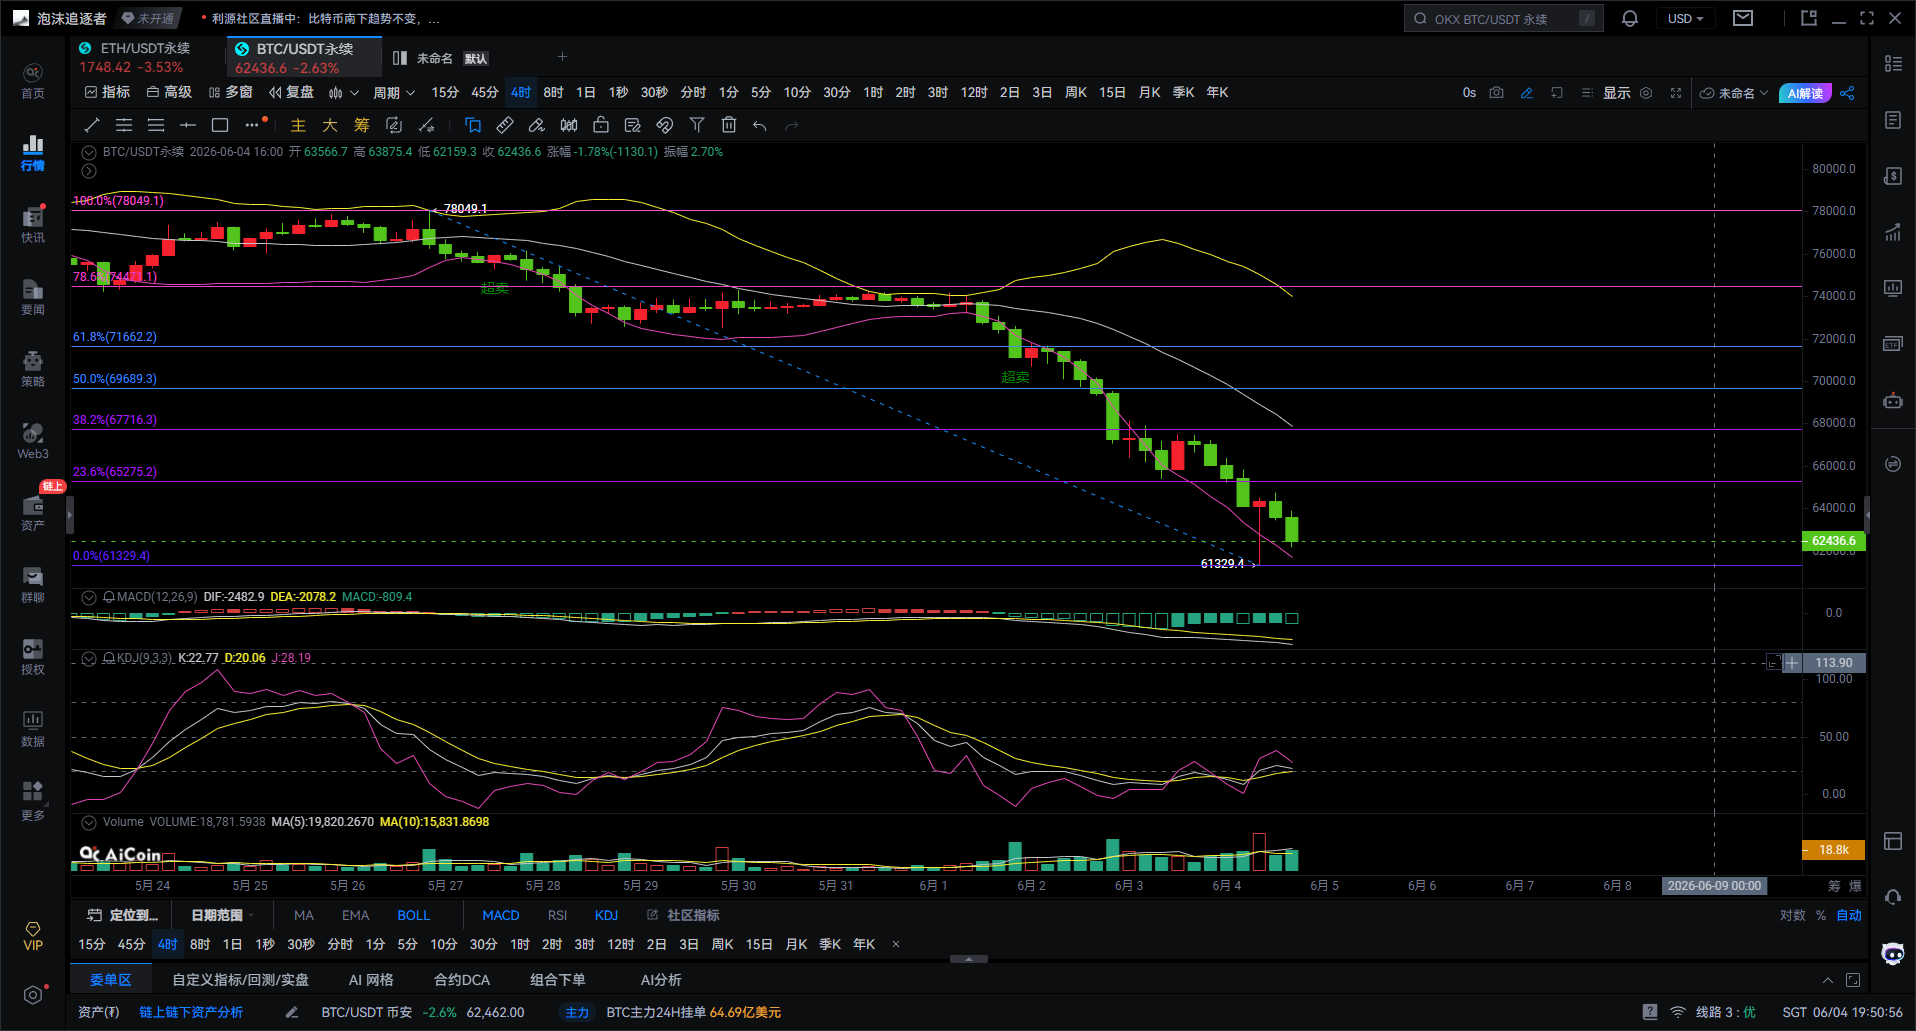
From the four-hour chart, it is clear that the market is obviously under bearish control, with no signs of stabilization in the short term. Let's take a look one by one.
First, let's talk about MACD. DIFF and DEA have been in a death cross moving downward, with increasingly long green bars, indicating that the bears are not done yet. Although prices have fallen quite a bit, there is no obvious bullish divergence signal on the MACD, which means the decline is not over, and further downward exploration is needed.
Next, looking at KDJ, all three lines are flat at low levels, with J value around 20, which can be considered oversold territory. A short-term technical rebound could occur at any time, but in a bearish market, oversold does not mean a bottom; at most, it is a rebound adjustment during the decline.
Regarding the Bollinger Bands, the opening has widened downwards, and prices have been consistently touching the lower band, indicative of a typical one-sided downward trend. The middle band has already shifted down to about 68000, posing significant pressure in the short term; as long as prices do not regain the middle band, the bulls cannot turn things around.
Analyzing the Fibonacci retracement levels, the decline from the high of 78049 to the low of 61329 has several key levels: 23.6% resistance at 65275, 38.2% resistance at 67716, 50% resistance at 69689, and 61.8% resistance at 71662. Currently, the price is around 62436, quite close to the 0% support level at 61329.
It is my view that 61300 is the last important defense line. If 61300 can hold, there is a chance for a short-term rebound to the area of 65200 to 67700. However, if 61300 breaks, the bears will launch a full-scale attack, and we might see the round number of 60000, or even around 58000.
Let's clarify the trading strategy. Below 65200, maintain a short position on rebounds. 65275 is the first resistance level. 67716 is the dividing line between bulls and bears. 61329 is the short-term lifeline. If it breaks 61329, the bear target looks at around 60000.
Currently, all indicators on the four-hour chart, including moving averages, MACD, and Bollinger Bands, point towards bearishness. I advise everyone not to rush to catch the bottom at this stage; instead, wait for the MACD to show bullish divergence or for a substantial recovery above 65275 before considering the possibility of a trend reversal. The overall rhythm emphasizes bearish dominance, focusing on short positions during rebounds.

Rather than giving you a hundred percent accurate advice, it is better to provide you with a correct mindset and trend. Teaching one to fish is better than giving them fish; the advice may earn you temporary profits, but the mindset will teach you to earn for a lifetime!
Date of writing: (2026-05-27, 23:10)
(This article is written by Daxian talking about coins) hereby declare: Network publishing has a delay, the above suggestions are for reference only. Investment involves risks, and entry into the market requires caution!
免责声明:本文章仅代表作者个人观点,不代表本平台的立场和观点。本文章仅供信息分享,不构成对任何人的任何投资建议。用户与作者之间的任何争议,与本平台无关。如网页中刊载的文章或图片涉及侵权,请提供相关的权利证明和身份证明发送邮件到support@aicoin.com,本平台相关工作人员将会进行核查。


