Cryptocurrency Expert: Ethereum 6.4 Bollinger Bands Fully Open Downward! Is the Overfall of Ethereum Just an Illusion, with Another Round of Continuous Decline on the Way? Latest Market Analysis and Trading Suggestions
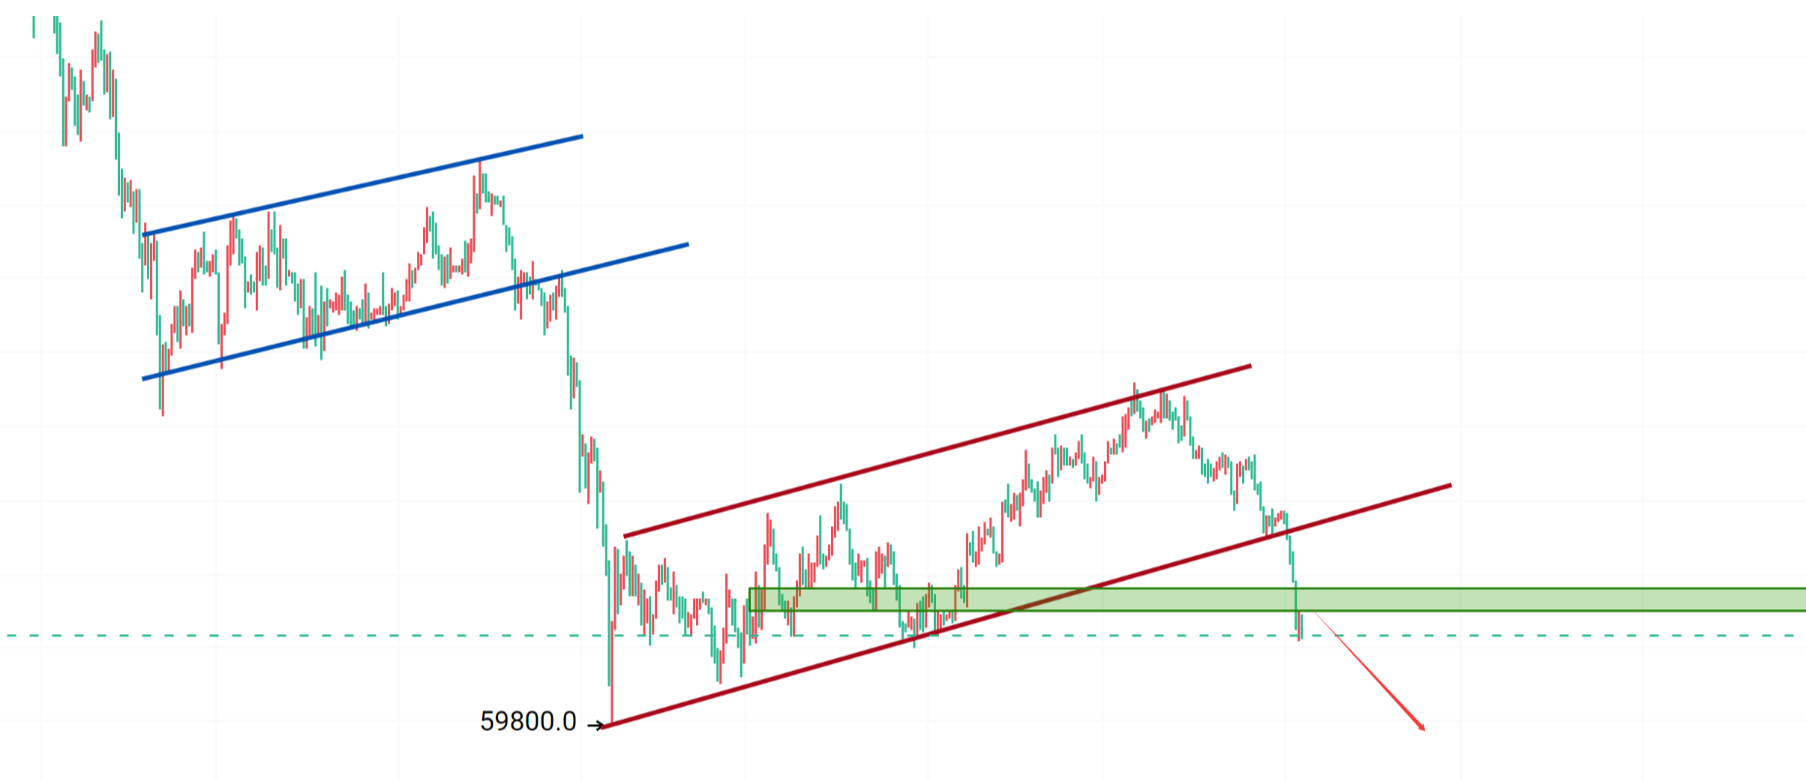
The current price of Ethereum is 1830. In the past few days, I have received messages from cryptocurrency friends; most have been confused by Ethereum's decline, falling continuously from above 2400, and many who tried to bottom out or short sold have found themselves stuck. Many retail investors cannot distinguish between a bottom rebound or a continuation downward. Blindly entering the market will either lead to being deeply stuck or incur losses. The most feared thing in trading is to bet on price movements purely based on feelings without relying on indicators and key levels. Today, I will clearly break down the current Ethereum trend, support and resistance levels, and precise entry and stop-loss points. Whether for short-term trading or spot positioning, after reading, everyone can avoid most pitfalls and misunderstandings, providing a reference for both beginners and experienced traders.
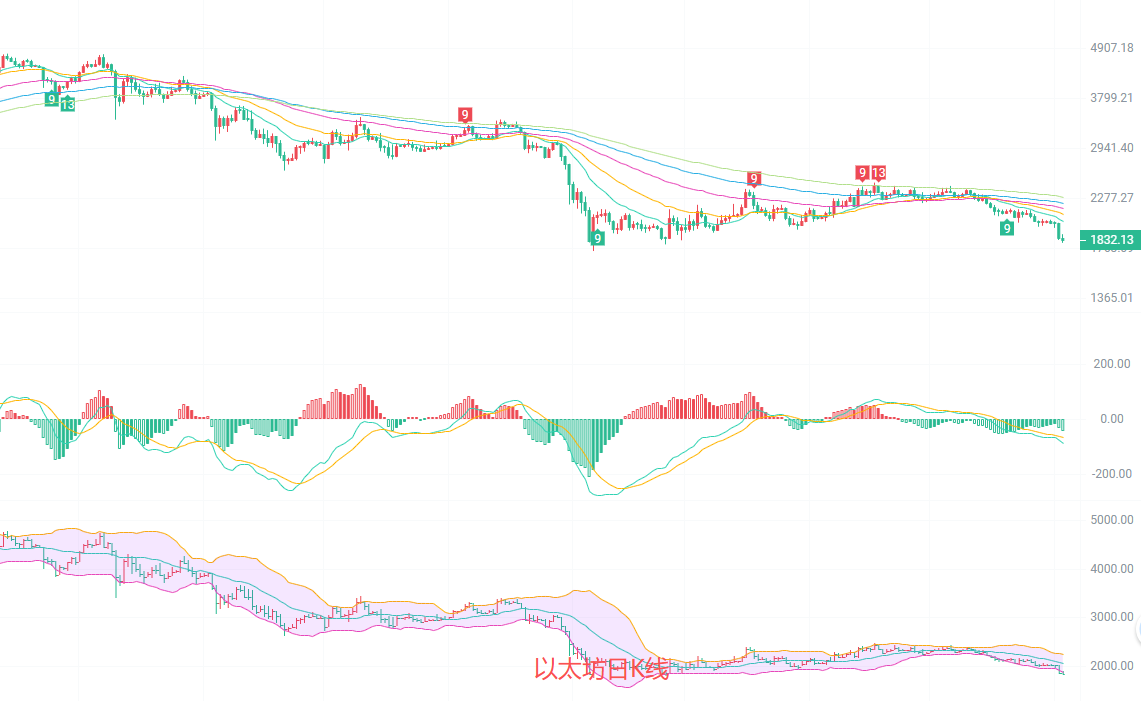
The daily candlestick price has steadily fallen below all EMA moving averages, with the EMA 15/30/60 arranged in descending order from top to bottom, continually suppressing upward price movement. The daily Bollinger Bands price is resting below the lower band at 1875, and the Bollinger Bands are opening downward, completely opening the downward trend; the MACD indicator's DIF and DEA are below the zero line, with green bars slightly increasing, and downward momentum has not yet exhausted. Previous support points of 2200 and 2000 have all turned into strong resistance levels, with the daily large cycle clearly showing a downward dominance, and only a minor technical rebound exists due to short-term overselling, but the rebound is mainly pressured to fall back, making it difficult to change the overall downward direction.
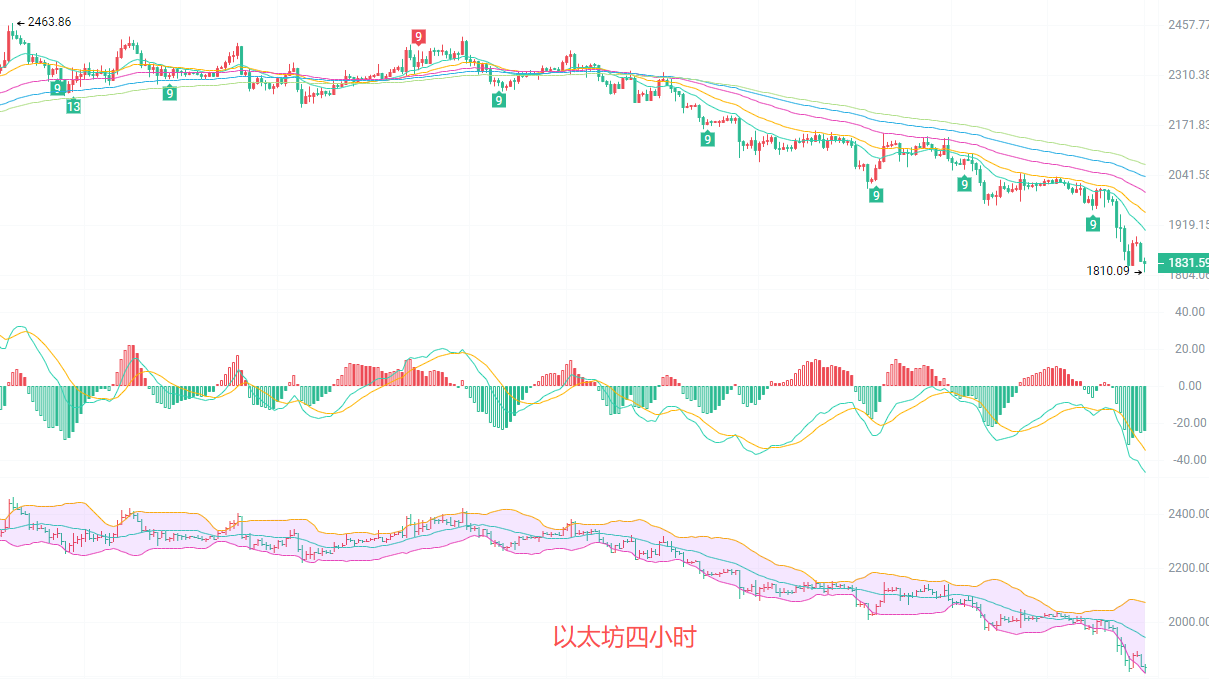
The four-hour candlestick has continuously closed in the red, with the price operating below all short-term EMA moving averages, while the EMA 15 and 30 are turning down and exerting layered pressure on the price. The area above 1900 has become the first strong resistance level. The 4-hour Bollinger Bands are opening downward, with the price running near the lower band around 1809, maintaining a weak trend; the MACD dual lines are at a low position below the zero line, with green bars continuing to increase in volume, showing sufficient short-term downward momentum. The slight recovery with small green candlesticks is merely a repair for overselling; until it breaks above 1900 with volume, any rebound provides an opportunity to exit positions and reenter shorts, and the short-term weak oscillation pattern is unlikely to reverse in the near term.
Short-Term Reference:
Short position from 1880 to 1920, with a stop loss at 1950, targeting 1830 to 1800.
Long position from 1800 to 1750, with a stop loss at 1700, targeting 1850 to 1880.
Specific operations should primarily rely on real-time market data. For more detailed information, you can consult the author. There can be delays in article publication, and the suggestions are for reference only, with risks borne by the reader.


Friendly reminder: The above content is only created by the author for the official account and Weibo. Advertisements at the end of the article and in the comment section are unrelated to the author. Please discern carefully, and thank you for reading.
免责声明:本文章仅代表作者个人观点,不代表本平台的立场和观点。本文章仅供信息分享,不构成对任何人的任何投资建议。用户与作者之间的任何争议,与本平台无关。如网页中刊载的文章或图片涉及侵权,请提供相关的权利证明和身份证明发送邮件到support@aicoin.com,本平台相关工作人员将会进行核查。