Cryptocurrency Scholar: The southward trend of Bitcoin at 64,000 remains unchanged, what to do if stuck while heading north? How to break the situation? Latest market analysis and operational suggestions
The current price of Bitcoin is 66,000, many cryptocurrency friends have recently been stuck to the point of despair, falling from a high point all the way down to 66,000, trying to catch the bottom only to get stuck again, chasing shorts while fearing a sudden rebound and missing out. Every day, they watch the market and become increasingly entangled. Many retail investors only follow the trends without understanding the fund flows behind moving averages and indicators, blindly entering the market and ultimately incurring repeated losses. Today, we will dissect the real trend of Bitcoin, clarifying the short-term bullish and bearish dividing line and safe entry points. Whether you are heavily stuck or a new friend waiting to enter, reading this piece will help you clarify the operational thinking for the next steps, avoid the old habits of chasing highs and cutting losses, and find a steady pace for trading.
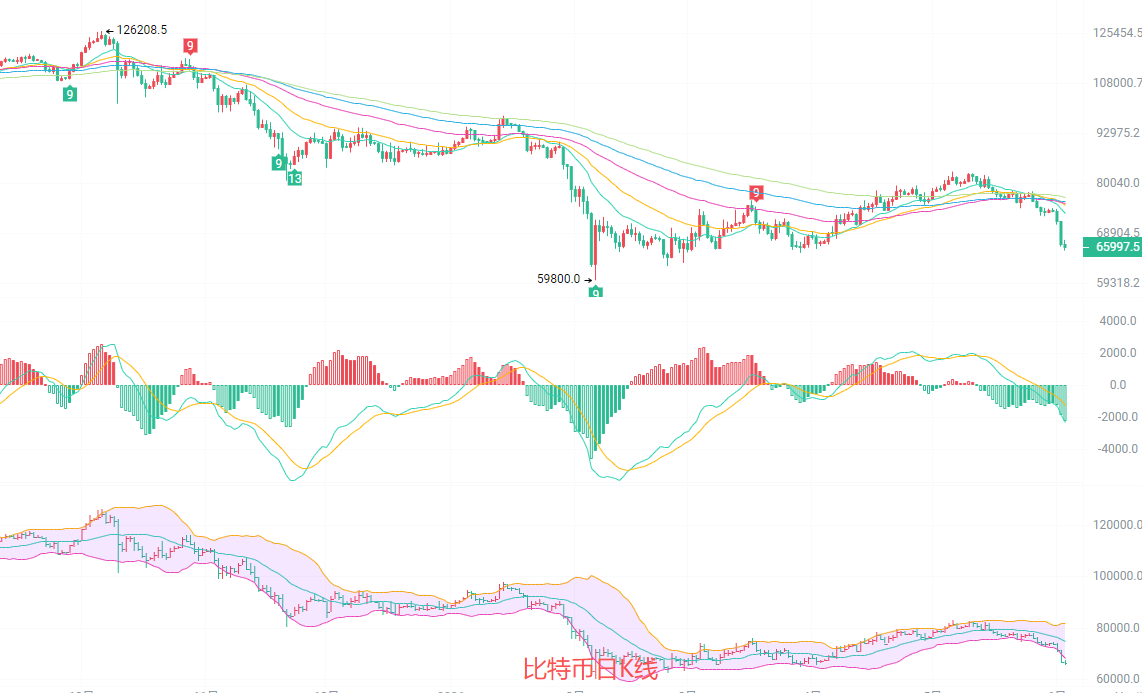
The daily candlestick chart has broken all short-term moving averages EMA15, EMA30, EMA60 downwards; the moving averages have turned downwards forming a layered pressure pattern. The Bollinger Bands are expanding downwards, with the coin price steadily running below the lower track of 68,093, showing no obvious sign of narrowing the southward trend. The MACD indicator DIF continues to be below DEA, and below the zero axis the green bars are extending in volume, with southward momentum still dominating. The previous support level at 72,000 has been completely lost, and the daily trend has shifted from a range to unilateral downward, with the first heavy pressure above at the daily MA30 of 69,000-70,000 and the key support below at 65,000. If this level is broken, it will open up a new downward space.
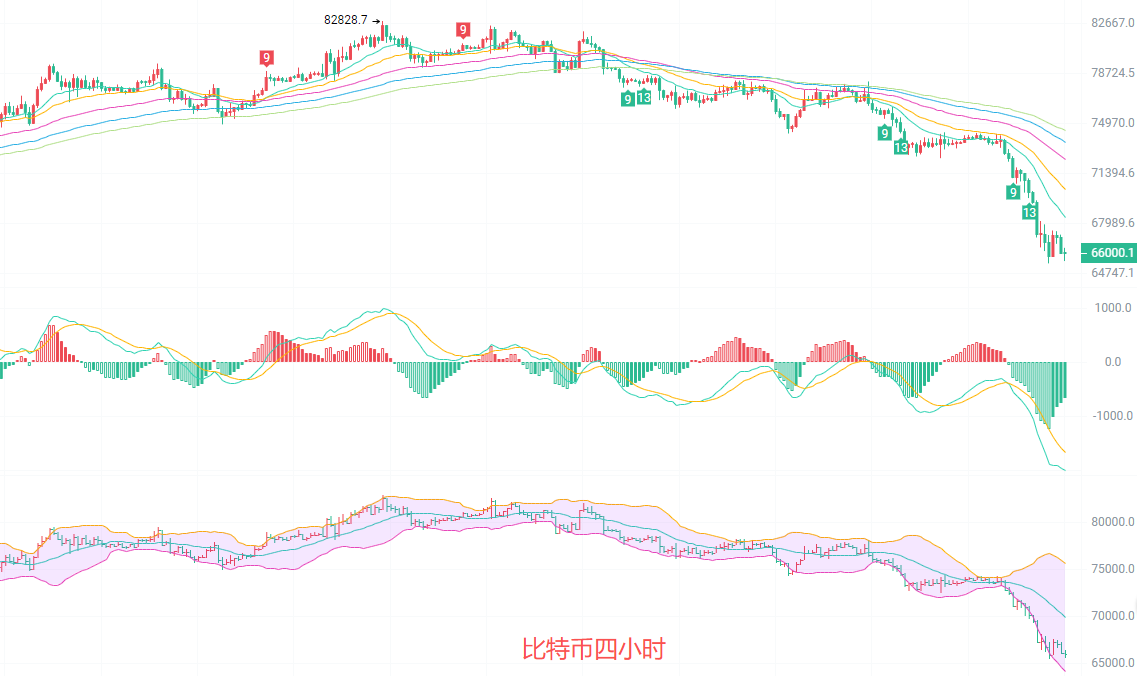
In the four-hour candlestick chart, all moving averages EMA15/30/60/90 are arranged in a southward order from top to bottom, with the price running below all moving averages for a long time; short-term rebounds are all suppressed and fall back by the moving averages. The Bollinger Bands continue to open downwards, the coin price is slightly oscillating above the Bollinger lower track at 64,160, currently in a weak bottoming phase after being deeply oversold. The MACD remains below the zero axis, with DIF at 2002 and DEA at 1679 continuing downwards. Although the green bars have shortened slightly, no effective golden cross reversal signal has appeared. There is a technical demand for a slight rebound due to short-term overselling, but the larger cycle's southward structure is intact; rebounds are only seen as a recovery during the southward trend, and are unlikely to change the overall downward trend.
Short-term thinking reference: Go with the major cycle trend, small stop loss with quick in and out
Buy from 75,400 to 74,900 with a stop loss at 64,500, targeting 66,500 to 67,200
Sell from 67,500 to 68,000 with a stop loss at 68,500, targeting 65,500 to 64,500
Specific operations should focus on real-time data from the market; for more information details, you can consult the author. The publication of the article is delayed, so the advice is for reference only, and the risk is borne by the reader.


Warm reminder: The above content is only created by the author for the official account and Weibo; the advertisements at the end of the article and in the comments are not related to the author, please identify carefully, thank you for reading.
免责声明:本文章仅代表作者个人观点,不代表本平台的立场和观点。本文章仅供信息分享,不构成对任何人的任何投资建议。用户与作者之间的任何争议,与本平台无关。如网页中刊载的文章或图片涉及侵权,请提供相关的权利证明和身份证明发送邮件到support@aicoin.com,本平台相关工作人员将会进行核查。