First of all, let me clarify for everyone, powerful coins that have made it to our trending list should not be shorted easily, especially coins like HYPE and CEC that the entire market is paying attention to. Once it enters a following phase, shorting can easily become fuel for the main force's pull-up. This point must be remembered.
Let's take a look at the current market situation. Bitcoin is currently fluctuating around the important psychological level of 70,000. Whether this position can be held is very crucial. If it breaks down effectively, it could likely drop to 65,000 or even lower. From the main force's movements, when it just fell below 70,000, many bulls were stopped out, and the market shows a dense array of market sell orders. However, during the last wave down, there were shorts covering their positions, and a small number of bulls entered to catch the bottom. Looking at the open interest difference, it still signals the main force's exit. Generally, in this situation, there may be a small rebound in the short term, but any rebound without volume is just playing tricks, so do not chase long positions easily.
The situation in the spot market is clearer. The main force on Binance has continuously sold off since yesterday, with a large holder selling over 80 million in the afternoon. Previously, another large holder bought 100 million at a high price, and if he hasn’t exited yet, he is likely facing a floating loss of several hundred thousand by now. On OKX, a small number of large holders have started to catch the bottom, but the volume isn’t large, only over a million, which cannot support the market at all. It is particularly important to note Kraken and Coinbase, as these two platforms represent institutional funds in the US market. Today, both platforms have shown large amount of spot sell orders, totaling over 40 million, and shortly after, Bitcoin broke below 70,000. The movements of institutional funds are always the most valuable for reference.
Having discussed the market situation, let’s move to today’s core topic: how to accurately pinpoint exit points and prevent profits from taking a roller coaster ride. Many friends have asked me what reference should be used for taking profits and setting stop losses. There are primarily two types: one is a method that everyone can use for free, and the other is a Pro version based on real funds data, which is objective. We will discuss these separately so that everyone can choose according to their situation. 
First, let’s talk about the three methods of the free version, which will be clearer when you operate on your computer. The first and simplest method is to use the recent high and low points of the market as references; you can use the period you usually rely on. For example, if a recent range has a low of 74,300 and a high of 78,000, and you shorted within this range, then the profit-taking point can refer to the previous low. However, it is recommended to set the point slightly lower than the previous low because the main force often dips slightly below the previous low to sweep stop losses before rebounding. Always leave a little room for error. If a low point has been tested multiple times, its reference value will be higher, as the market has memory; those who previously entered at this price are likely to buy again if the price comes back to this level, naturally forming support. The same logic applies to resistance levels, where a previously tested high will have strong selling pressure.
The second method is the Fibonacci retracement line, which has been shared by the director many times before. Its usage is simple: find a complete upward or downward trend and connect its high and low points to automatically generate retracement lines. If the current situation is a downward trend, look for the high and low points of the earlier upward trend; if it’s an upward trend, look for the high and low points of the earlier downward trend. We focus on the 0.618 level, which can be considered the last defense line. When the price drops to this level, there is generally a strong support. If you shorted at a high position, you can take profits at positions like 0.236, 0.5, and 0.618 in batches. It is better not to wait until it reaches exactly those levels to exit; exiting slightly earlier is important for securing profits. Now that Bitcoin has broken below 0.618, the situation isn’t optimistic. The next support level is at 0.786, although it's unlikely to drop directly that low in the short term. If you find drawing lines troublesome, you can look for my published automatic Fibonacci indicator in the community indicators; it will automatically identify high and low points to draw lines, suitable for short-term trading.
The third method is moving averages, which everybody should be familiar with. When the moving average is above the price, it acts as resistance; when below, as support. We can perform exit operations near the moving average. I personally like to use the 20 and 30 periods’ moving averages. Generally, during a rebound, the price will first touch the 20-day moving average, which is where you can close the first batch of positions. At the 30-day moving average, close the second batch, and if it can break through the 30-day moving average, consider leaving a portion of your position for higher returns. For hot coins like HYPE and LAB, you can also use ultra-short moving averages to find exit points. They have large fluctuations but strong trends; hitting the moving average without breaking is a good entry signal, while conversely, hitting resistance at the moving average is a sell signal.
However, you may have also noticed that all three methods mentioned above share a common problem: they are too subjective. Different people might spot different high and low points in the same market trend, and the moving average parameters they use can also vary, resulting in different exit points. Moreover, these methods are based on historical data, reflecting past situations and cannot inform you about the current level of selling or buying pressure. If you already have a set of trading rules, continue to use them without issue. But if you want more objective and accurate signals, I recommend using Pro version methods based on real funds data instead.
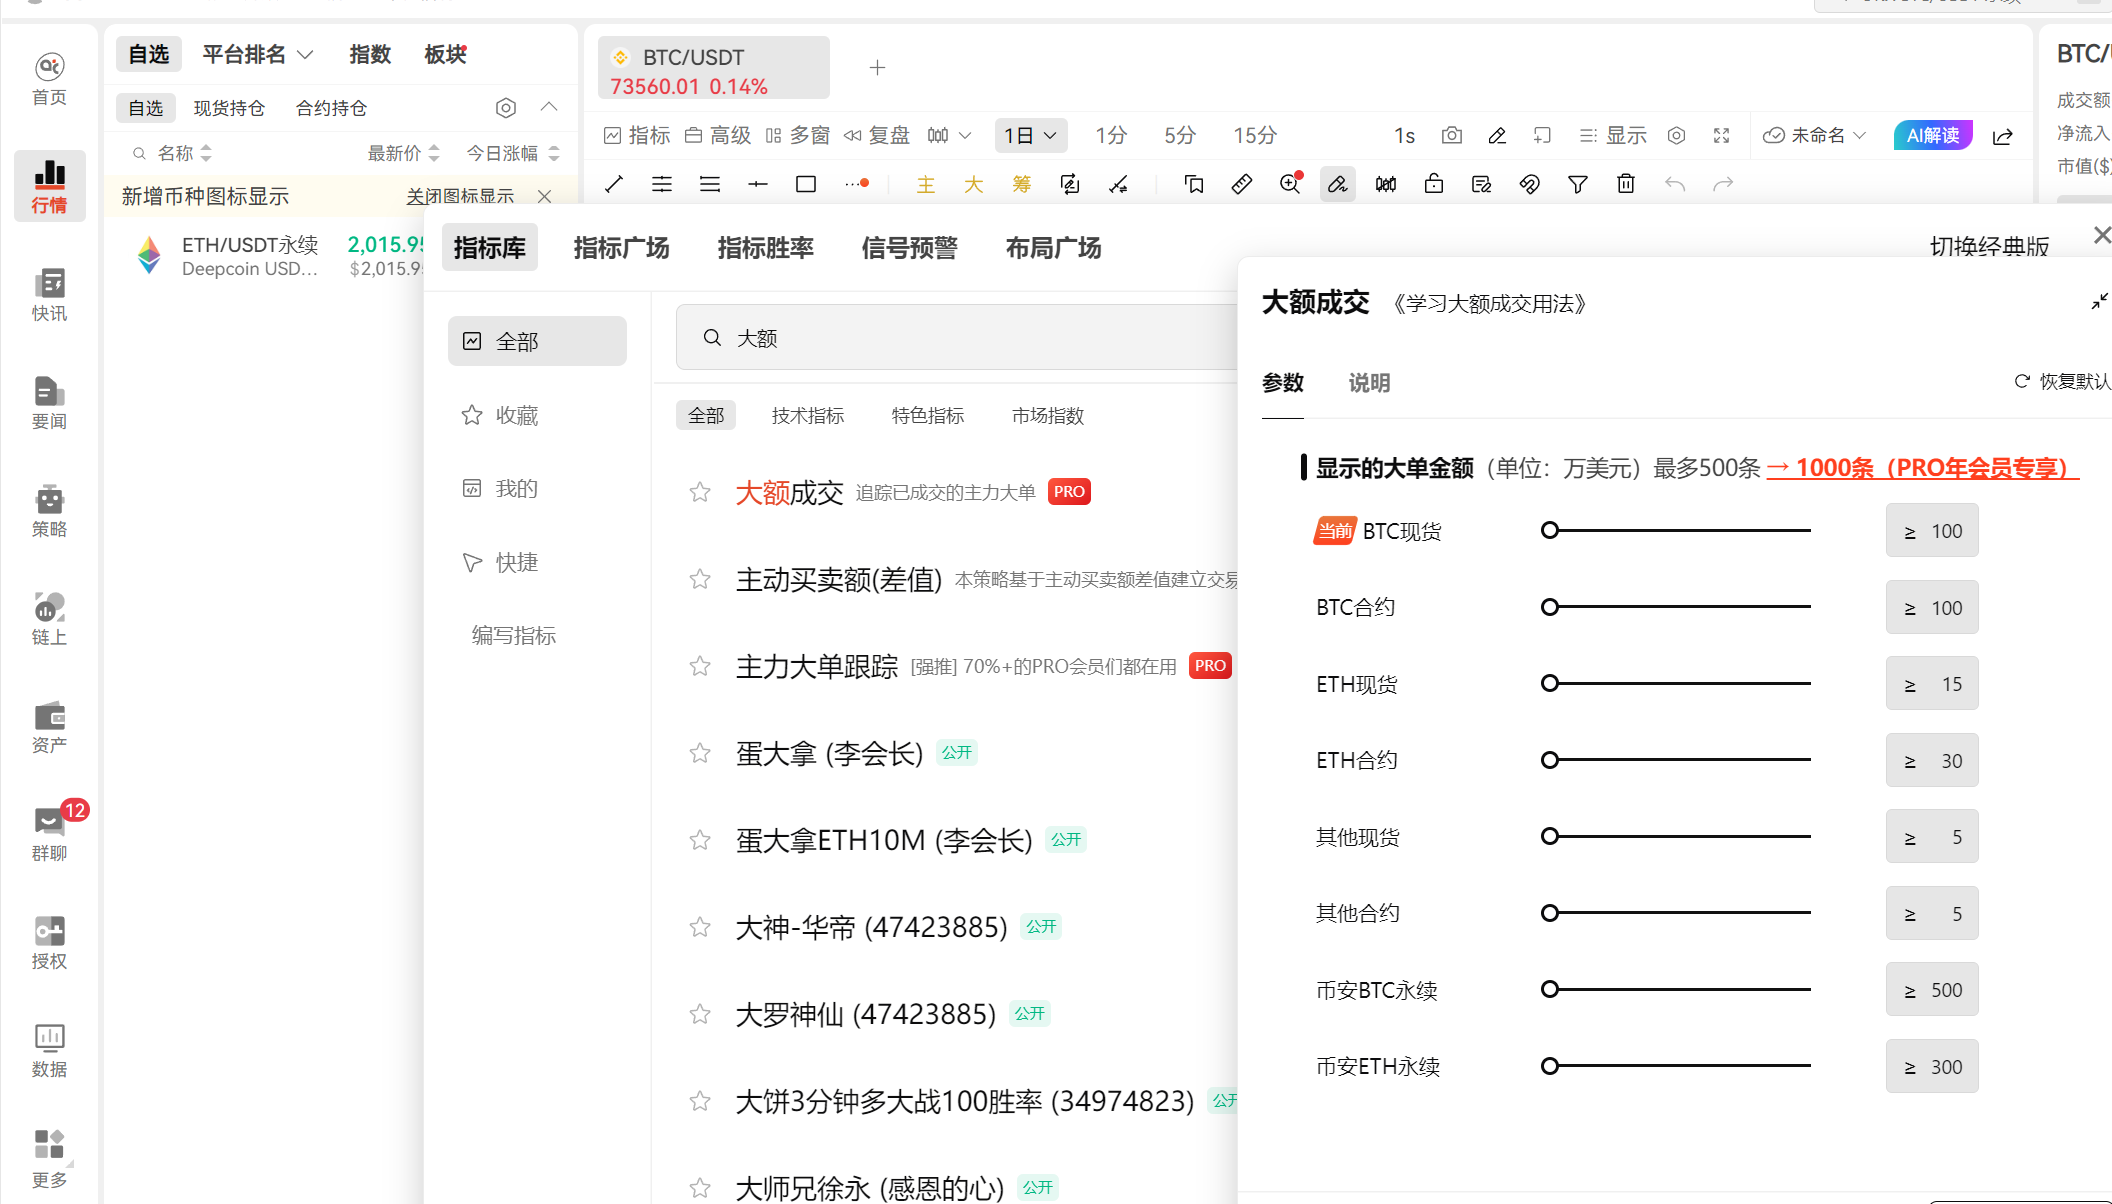
The three core tools of the Pro version can help you find the true consensus price level in the market, which is the most reliable exit reference. The first is the main force big order tracking indicator. We all know that 80% of the funds in the market are controlled by the main force, and the positions of their orders are their target levels. This indicator can aggregate the main orders from multiple platforms, and we only need to look at where the orders are most dense, which is where the strongest consensus support or resistance is located. For instance, in Ethereum currently, there are very dense orders at the 2,000 dollar mark, with multiple platforms’ main forces placing orders there, making it a strong resistance level. If you hold a long position, consider exiting in batches as it rebounds to this level. If the order overlaps with the clearing magnetic zone, the probability of reaching this position is higher, which can almost be considered a definite target level.
The second tool is chip distribution, which is better than Fibonacci in that it does not require you to find high and low points by yourself. The system automatically counts historical transaction data to tell you which price level has the most chips. We primarily look at the peak value of the chip distribution, which is the POC (Point of Control); it’s the price level with the most concentrated transactions over a period. Once it is broken, it will change from support to resistance. For instance, Bitcoin’s recent POC over the past three months is at 70,700, and it has now fallen below that. Therefore, any future rebound to this position would be an excellent shorting point. If you are shorting and looking for profit-taking points, look at the chip peak below; Bitcoin’s next support is at 68,300, and lower is at 66,700. At these points, consider closing your shorts in batches; don’t be greedy.
The third tool is the full depth indicator, which is particularly suitable for coins that are hitting new highs or lows, as high and low points and Fibonacci methods become ineffective without historical data for reference. The full depth will aggregate all current buy and sell orders in the market, displaying them on the price axis; green indicates buy orders, and red indicates sell orders; the taller the bar, the densest the orders at that location. For example, LAB has already reached historical new highs, and there is no historical resistance above. We rely on full depth data, where there are over 70,000 sell orders stacked at the 20 dollar mark, indicating a strong pressure level. Any longs reaching here should consider taking profits. If it breaks through 20, then look at the next cluster of sell orders at 23 dollars. Conversely, during a drop, look at the positions where buy orders are accumulated below for support levels.
These three tools are based on real market and transaction data, with no subjectivity, reflecting the market's actual consensus with real money, which is much more reliable than drawing your lines. Furthermore, they each emphasize different aspects: main force orders are suitable for finding short-term target levels, chip distribution is best for medium to long-term support and resistance judgments, and full depth is ideal for extreme market situations without historical reference. The best results come from combining them.
Finally, I want to emphasize once again that the current market is challenging. Don’t blindly chase rising or falling prices, especially for those strong coins that have made it to the trending list; do not short easily. If you hold positions, make sure to set your profit-taking and stop-loss orders in advance, so that profits do not turn into losses. The exit methods discussed today can be used for free; for friends wanting more precise signals, you can take advantage of the 10% discount in the live room to activate the Pro version. Friends who win can first experience the main force big orders and chip distribution features once their memberships are credited. If you have any confusion, feel free to reach out to me in the Pro group, as I have been quite active recently and will address everyone’s questions one by one.
This article represents only the author’s personal views and does not represent the platform's stance or views. This article is for information sharing only and does not constitute investment advice for anyone.
免责声明:本文章仅代表作者个人观点,不代表本平台的立场和观点。本文章仅供信息分享,不构成对任何人的任何投资建议。用户与作者之间的任何争议,与本平台无关。如网页中刊载的文章或图片涉及侵权,请提供相关的权利证明和身份证明发送邮件到support@aicoin.com,本平台相关工作人员将会进行核查。