Dear friends, I am Sister Qinglan. This morning when I opened the market, the market sentiment was indeed not great. Two major bearish news directly hit us: one is BTC flashing crash below $71,000, dropping 3.71% in 24 hours, and the other is the crypto fear index falling to 23, returning to the extreme fear range. This kind of combination often means that short-term selling pressure has not been completely released, especially with such a low fear index, retail investors and leveraged funds are prone to panic selling. However, looking at it from another angle, extreme fear is often an emotional indicator of a stage bottom; the key is whether the price can stabilize at critical levels. Today we will use the Qinglan TPV system to analyze the real state of the current market.
Current Price and Time
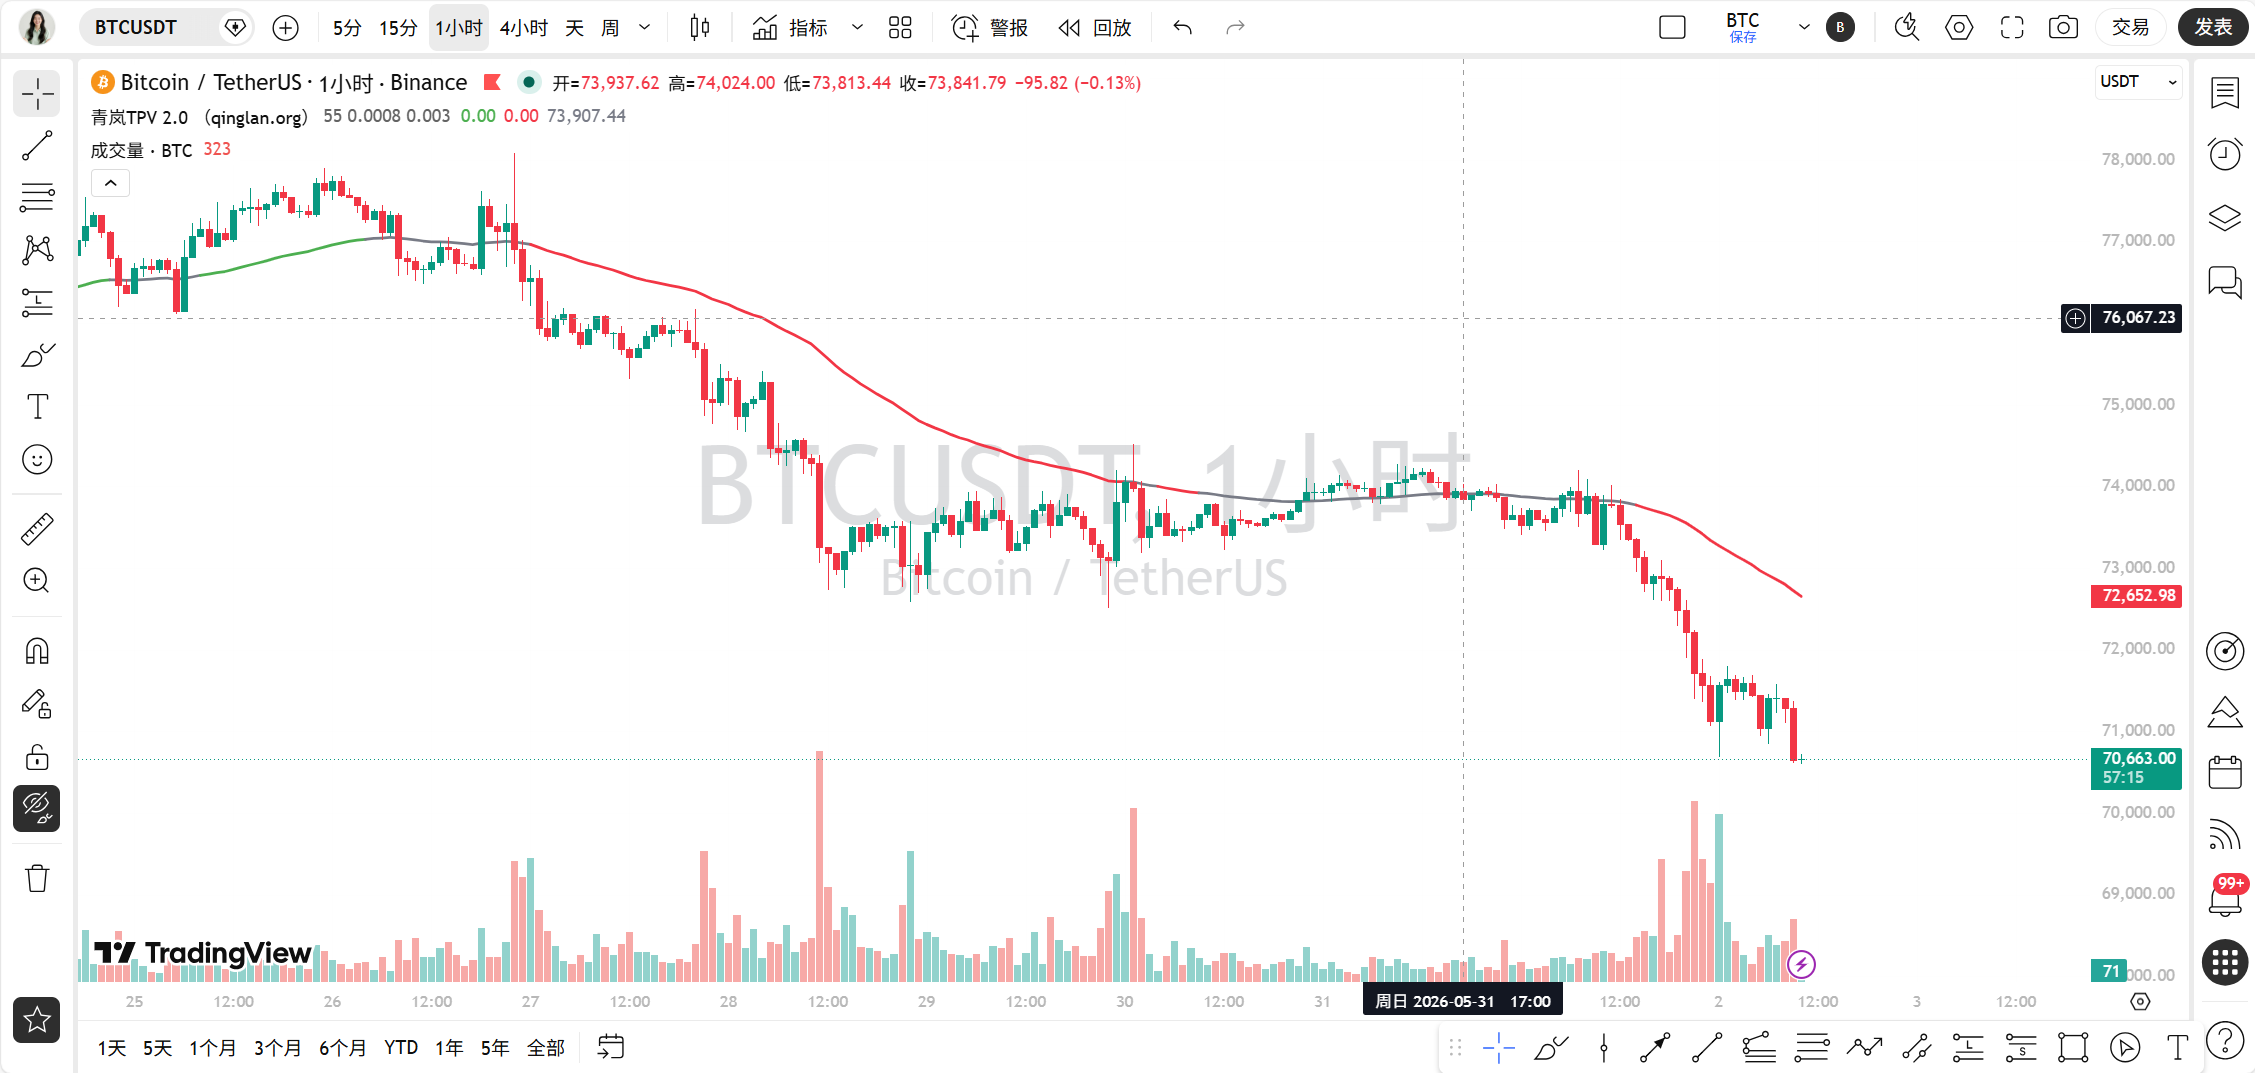
The current time is 10:00 AM on June 2, with the latest BTC price at 70,681 USDT. The drop in the past 24 hours is 3.08%, and the market share is 56.64%, indicating that funds are still avoiding risk in BTC, but overall risk appetite is extremely low.
Multi-Period Status Overview
First, let's look at the daily chart. The MA5 on the daily chart is at 72,621, MA10 is at 74,149, and MA30 is at 77,515; the price of 70,681 is far below all moving averages, clearly in a bearish arrangement. The MACD's DIF is -1,553, DEA is -894, and the histogram is -658, indicating a dead cross state, and the green bars are still expanding. The RSI is only 24.63, which is in the oversold area. The daily signals are very clear: bearish dominance, but oversold may brew a rebound.
The 4-hour chart is even worse. MA5 is at 71,458, MA10 is at 72,477, and MA30 is at 73,243; the price of 70,681 is also below all moving averages. The MACD's DIF is -816, DEA is -577, and the histogram is -239, indicating a dead cross and expanding green bars. The RSI has dropped to 18.79, which is extremely oversold. Bearish momentum on the 4-hour chart is still being released, but the degree of overselling suggests that short-term rebound demand is accumulating.
On the 1-hour chart, MA5 is at 71,087, MA10 is at 71,266, and MA30 is at 72,365; the price of 70,681 is below all moving averages. The MACD's DIF is -611, DEA is -568, the histogram is -43, indicating a dead cross but the green bars are shortening, which is a positive signal, suggesting that the bearish momentum on the 1-hour chart may start to exhaust. The RSI is 28.40, also entering the oversold area.
On the 15-minute chart, MA5 is at 70,974, MA10 is at 71,124, MA30 is at 71,286; the price of 70,681 is below all moving averages. The MACD's DIF is -153, DEA is -103, and the histogram is -50, indicating a dead cross but green bars are also shortening. The RSI is 38.23, although still in the weak zone, it is higher than the RSI on the 1-hour and 4-hour charts, indicating signs of stabilization in the short cycle.
TPV Signal Verification
Now let’s use the Qinglan TPV system for verification. The core rule is the 1-hour EMA55, with the current value at 72,625.74. The price of 70,681 is far below the EMA55, with a difference of 2.68%, not meeting the oscillation conditions. In the past 8 1-hour candles, the closing price greater than EMA55 occurred 0 times, and the crossing occurrence is 0, indicating that the market is in a clear one-sided bearish trend.
Shorting Condition Verification. First, the price is under pressure below the 1-hour EMA55, with 2 consecutive 1-hour candles closing below EMA55; this condition is satisfied. Second, pressure meets resistance, the current price failed to rebound from near 71,000, forming a long upper shadow, fitting the characteristics of a top formation. Third, the rebound is weak, although the 1-hour MACD bars are shortening, the RSI is only 28.40, not returning above 30, indicating that the rebound momentum is very weak. With all three conditions met, the TPV system gives a clear short signal.
The condition for going long currently does not hold. The price has not stabilized above EMA55, and the conditions for support stabilization and decline momentum exhaustion are also not met. Although the 1-hour MACD bars are shortening, the RSI is still in the oversold area, and there is no bottom formation or long lower shadow yet, so active longing is not possible.
On-chain/Fundamentals
On-chain data shows the fear and greed index is 29, which falls in the fear range but has not reached the extreme fear level of 23. In the past 24 hours, liquidations across the network total $640 million, with long positions dominating, indicating that bulls are collapsing and short-term market sentiment is weak. Regarding whales, Ethereum whales continue to sell 5,000 ETH, having cashed out a total of $140 million, and large short positions are also increasing, showing that institutional bearish sentiment is strong. However, Trump stated that he might reach an agreement with Iran within a week, which could lead to a potential drop in oil prices, a potential positive for risk assets, but the impact is indirect, and short-term capital inflow is not yet seen.
Key Offensive and Defensive Positions
The most critical resistance level is the 1-hour EMA55 at 72,625, which is the boundary between bullish and bearish. If the price rebounds to this position, it will likely come under pressure again. The support below is at the psychological support level of 70,000. If it breaks below 70,000, the next support is around 68,000, which is the low point area on the 4-hour chart. The short-term resistance above is at 71,000, which is a dense area of moving averages on the 15-minute chart.
Trading Ideas
Based on the signals from the TPV system, the current direction is bearish, but caution is needed since there is severe overselling, and a rebound could occur at any time.
Shorting Idea: If the price rebounds to the 72,000-72,600 area and shows a long upper shadow or top formation, and the 1-hour MACD bars expand again, a light short position can be taken. Entry Condition: The price touches around 72,500, with a 15-minute candle forming a bearish engulfing or long upper shadow. Place a stop loss above 73,000, and the target level initially looks at 70,000; if it breaks below, then look at 68,000.
Longing Idea: Currently, do not actively go long, but if the price shows a long lower shadow or bottom formation near 70,000, and the 1-hour MACD bars shorten for 2 consecutive candles, with the RSI rising from the oversold area back above 30, a light long position can be tested. Entry Condition: The price stabilizes in the 70,000-70,200 range, with a 15-minute candle forming a bullish engulfing. Place a stop loss below 69,500, and target 71,000 and 72,000.
Oscillation Treatment: Currently does not meet oscillation conditions, so interval strategy is not applicable.
Risk Warning
In one sentence: Under extreme fear sentiment, market volatility may intensify; strict stop-loss is required for any trades, do not hold positions.
Follow Qinglan Crypto Classroom to grasp more trading opportunities! Welcome to visit the official website www.qinglan.org
[Backtesting Data]
📊 Qinglan TPV Trading Strategy Backtest Reference
🕒 Last Backtest Time 06-02 07:00:02
Total Analysis: 1957 Backtests: 1633 Accuracy Rate: 67.5% (1103/1633)
免责声明:本文章仅代表作者个人观点,不代表本平台的立场和观点。本文章仅供信息分享,不构成对任何人的任何投资建议。用户与作者之间的任何争议,与本平台无关。如网页中刊载的文章或图片涉及侵权,请提供相关的权利证明和身份证明发送邮件到support@aicoin.com,本平台相关工作人员将会进行核查。