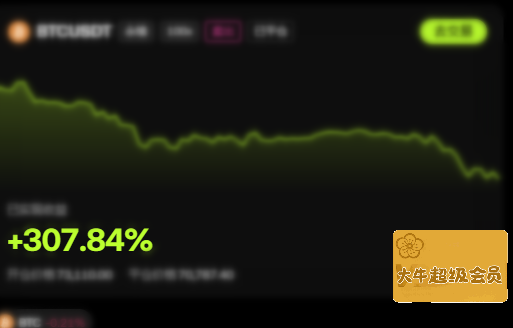
Recent series of market analysis has made it clear: this round of downward trend is not yet over, and the operation should firmly adhere to the strategy of going short. The market performance has fulfilled the predictions as expected, and the short positions that followed the layout have once again achieved three times the profit.
In last week's continuous updates, I repeatedly mentioned one view: after three consecutive daily bearish candles, the market will at most have a slight rebound or horizontal fluctuation, and after finishing its adjustment, the overall trend still goes down, with no basis for any market reversal found at this stage. At that time, two key pressure zones were delineated: 74200 and 75000, both of which are excellent entry points for bears.
The market has also fulfilled expectations, and after three days of fluctuating consolidation, the price directly started to decline from 74200. The pattern of these recent rounds of downward movements is very clear, and operating along the trend can yield good returns. An important signal has now appeared in the market, as the daily candlestick has broken below the wedge's lower boundary at 72000, formally confirming that the market has entered a phase of continuous bottom-seeking. Unless a huge buying force is able to pull back the price above the trend line, it will be difficult to reverse the weak market pattern.
Trading is fundamentally about following the market trend. In this round, after testing the wedge's upper boundary and reaching a high point, the price has been declining step by step, continuously breaking key support levels. Before any substantial change occurs in the pattern, the overall strategy should remain to short. The subsequent market is very likely to test the two important support levels at 65000 and 62000, and there is no exclusion of refreshing previous lows. If the support fails, a new round of trading opportunities will arise accordingly.
For a short-term shift from decline to rise, 69000 is the dividing line. This level is a concentrated trading zone where a large number of positions were held in the past, and it is also the 0.618 golden retracement level for the rise that started from 60000, indicating a need for a technical rebound. However, as long as the rebound cannot push back above the original downward trend line, this rise will only be a consolidation during the decline; there’s no need to anticipate bullish moves too early. Wait for the market to drop to the key support before observing changes in the market; short-term pressure is locked in the range of 72000-72500.
In summary, after breaking below 72000, it has shifted from support to strong resistance. Before the price stabilizes back at this level, every rebound to 72000-72500 is an opportunity to go short, with a short-term target at 70500 and 69000. For short positions held at lower levels, most can be reduced near 69000, and then the decision on the remaining position can be made based on the strength of the rebound at that time. Looking at the longer term, the probability of the market moving toward 65000 and 62000 is high.
Public account: Big Bull Talks Market
Disclaimer: The above is merely a personal sharing of market views and thoughts and does not constitute any trading advice. The market is rapidly changing, investment carries risks, and caution is advised when entering the market. Please make independent decisions and assume responsibility for gains or losses.
免责声明:本文章仅代表作者个人观点,不代表本平台的立场和观点。本文章仅供信息分享,不构成对任何人的任何投资建议。用户与作者之间的任何争议,与本平台无关。如网页中刊载的文章或图片涉及侵权,请提供相关的权利证明和身份证明发送邮件到support@aicoin.com,本平台相关工作人员将会进行核查。