Many traders find timing to be the most frustrating aspect: they are eager to enter the market but don't know which point is the bottom; after making a profit, they want to exit but fear missing out on the big market movements that follow. Today, I will explain two core EMA strategies. One includes custom indicators that can automatically monitor and alert you, and the other is a manual analysis method that is easy to understand at a glance. These strategies will help you firmly grasp trending markets and precisely time your entries and exits. Take the recent popular coin HYPE as an example—using my strategy, you can capture almost all of the main upward wave from its initiation to the present, and even beginners will find it easy to get started.
Before we begin, here's a special benefit for you: when you register on OKX using my invitation code AICOIN88, you can enjoy a 20% rebate on trading fees. I have also been using this link myself, and over the long run, it saves a considerable amount of money. Download and register for the OKX App here:
👉 Registration link: https://web3.okx.com/ul/joindex?ref=AICOIN88
👉 App download: https://jump.do/xlink?checkProxy=true&proxyId=24
After linking, whether you are using the strategy for high-frequency or long-term trading, you will minimize your trading fee costs.
EMA Bullish Resonance Strategy: Automate Capturing Main Uptrends
This is the core strategy developed by our research institute after countless backtests and optimizations, focusing on "stability, precision, and satisfaction," perfectly addressing the issue of timing for entry and exit. Its core logic is based on multi-period EMA resonance. A single EMA can only provide a general trend, but when multiple EMAs from different periods align in a bullish arrangement, it indicates that the trend has been established, significantly increasing the reliability of the signals.
Strategy Effectiveness and Parameter Optimization
First, let me show you the actual results. During the live broadcast on May 18, I used this strategy to analyze HYPE and BNB, and the subsequent movements perfectly verified the accuracy of the signals. In the K-line chart of HYPE, the green upward arrow represents a buy signal, and the hollow downward arrow indicates a sell signal. Every wave of upward movement was accurately captured, ensuring that the main uptrend was not missed, nor were there any losses during corrections.


The rapid surge in BNB over the weekend was also perfectly anticipated by this signal.
Many may wonder how to choose parameters. I made slight adjustments based on the classic EMA structure, removing the overly sensitive EMA5 and replacing it with EMA10. I also tested including EMA250, but ultimately defined the parameters as 10, 20, 40, 60, 120. These parameters currently show the best performance in both the crypto and U.S. stock markets. You can also fine-tune them based on your trading habits; for example, those trading long can increase the parameters while those trading short can slightly decrease them.
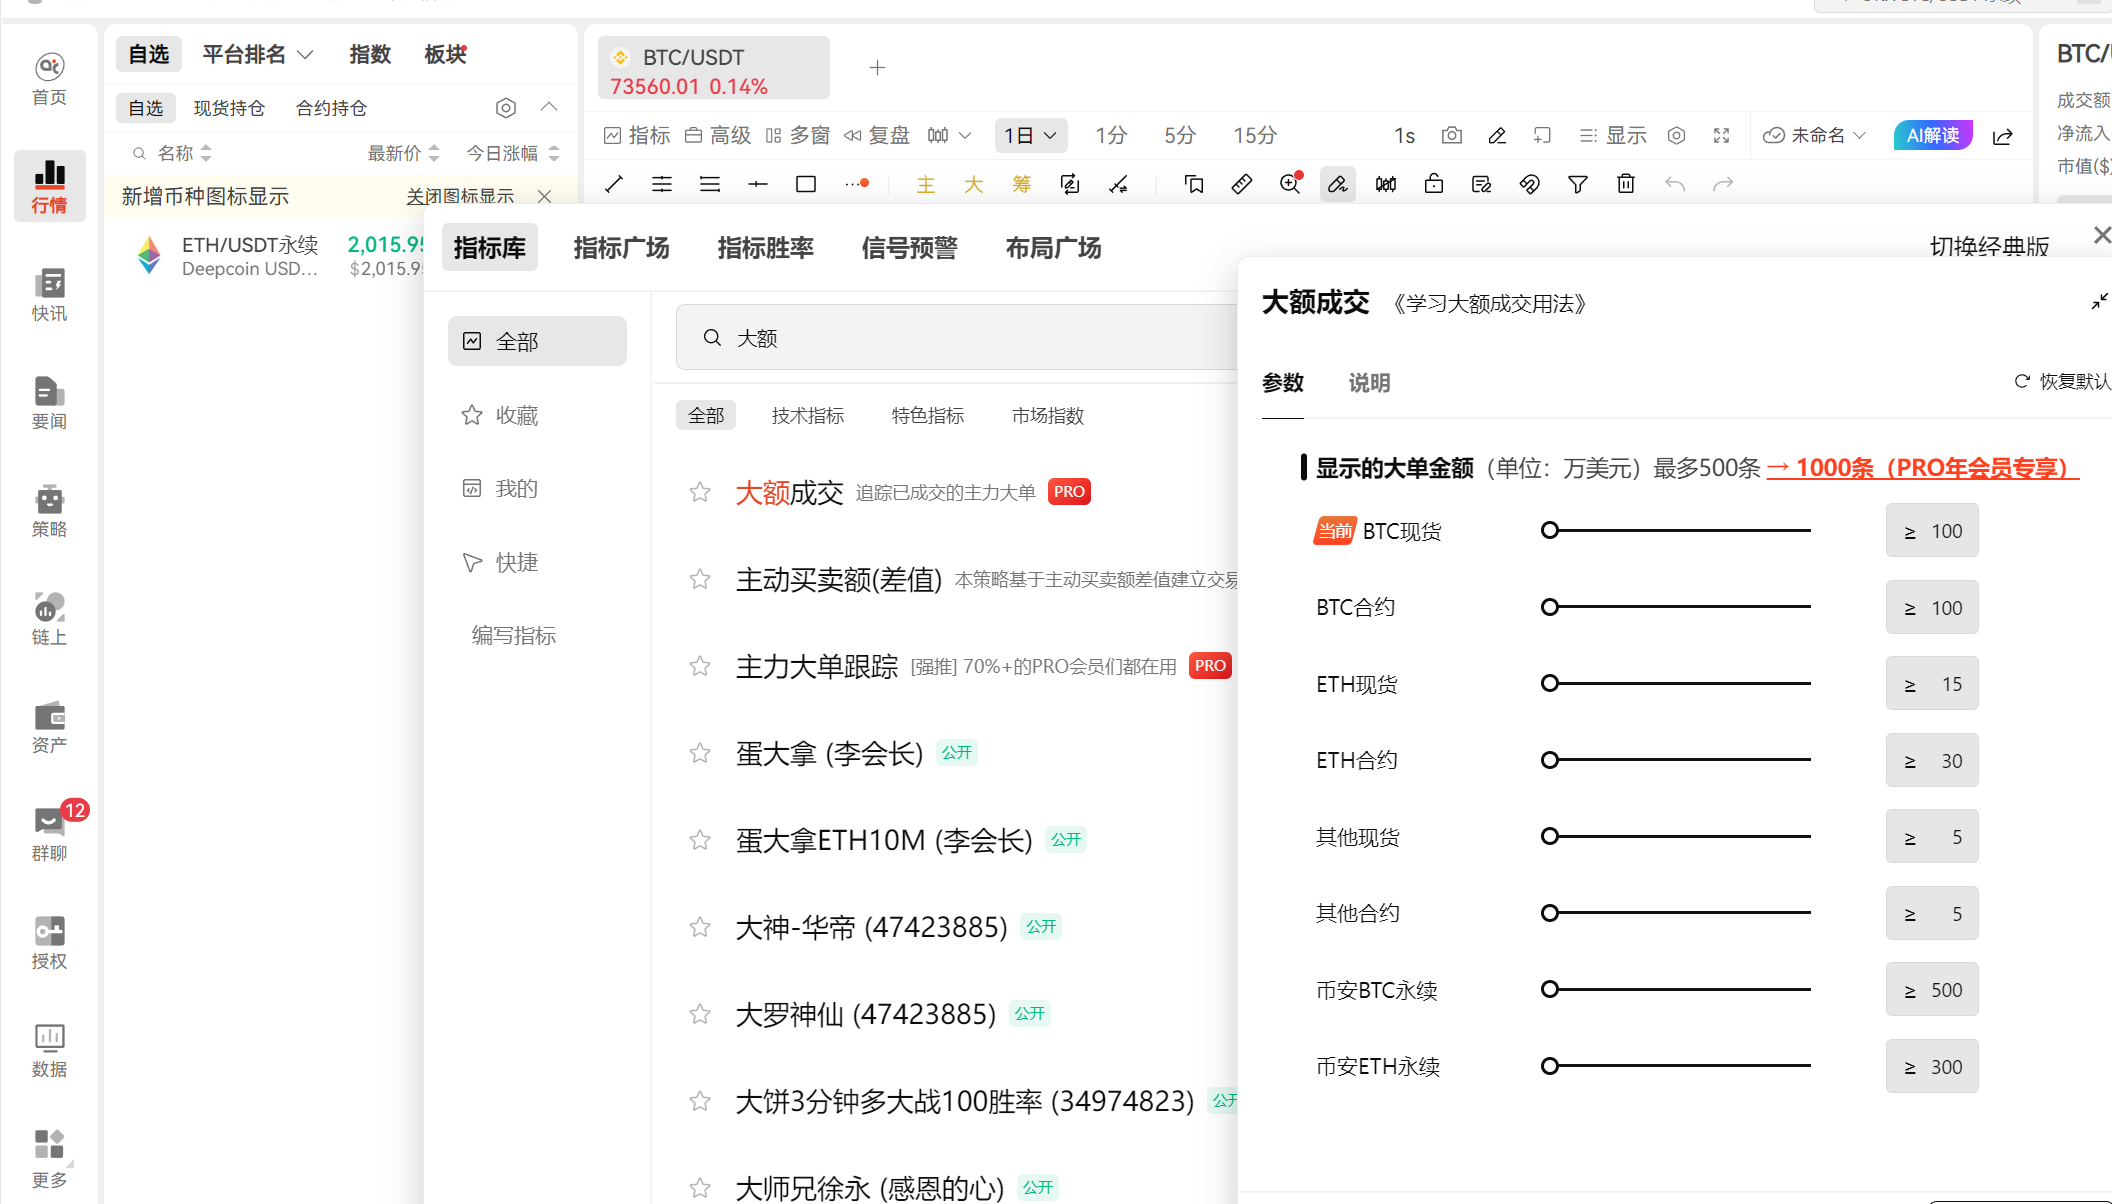
Complete Indicator Code and Usage Method
I am sharing the complete indicator code with you. Just copy it into the custom indicator editor in AiCoin, and it will work, complete with drawing, alerts, and automated trading functions:
// @version=2
ma1 = ema(close, 10)
ma2 = ema(close, 20)
ma3 = ema(close, 40)
ma4 = ema(close, 60)
ma5 = ema(close, 120)

// Calculate EMA bullish arrangement
maLong = ma1 > ma2 && ma2 > ma3 && ma3 > ma4 && ma4 > ma5

// Signal trigger points
longStart = maLong && (not maLong[1])
longEnd = (not maLong) && maLong[1]

// Alert settings
alertcondition(longStart, title='EMA Bullish Arrangement Started', direction="buy")
alertcondition(longEnd, title='EMA Bullish Arrangement Ended', direction="sell")

// Plot on chart
plot(ma1, title="EMA10")
plot(ma2, title="EMA20")
plot(ma3, title="EMA40")
plot(ma4, title="EMA60")
plot(ma5, title="EMA120")
plotShape(longStart, title="EMA Bullish Arrangement Started", shape='arrowUp', color='green', refSeries=ma3, placement='bottom', fill=true)
plotShape(longEnd, title="EMA Bullish Arrangement Ended", shape='arrowDown', color='green', refSeries=ma3, placement='top', fill=false)

// Auto trading (optional)
exitLong(longEnd, price='market', amount=1)
enterLong(longStart, price='market', amount=1)
After saving the indicator, enable the alert function. Whenever a bullish arrangement begins or ends, the system will automatically send you a pop-up reminder, eliminating the need to constantly monitor the market. If you want to automate trading, just bind the exchange API, and the system will automatically open and close positions based on the signals.
Wide Applicability
This strategy is highly versatile and can be used not only for trading cryptocurrencies but also for trading U.S. stocks, ETFs, and even mutual funds. For example, Micron Technology (MU) on HyperLiquid can be precisely captured through this strategy, catching every wave of upward movement while avoiding corrections (Figure 4). The stock market itself is characterized by a long-term upward trend. Using the EMA bullish resonance strategy to enter only when the trend is established and exit when it ends can significantly increase the win rate. Even buying the S&P 500 ETF over time would yield much higher returns compared to simply holding it without strategy.
Research Institute's Three-Moving-Average Strategy: Essential for Manual Analysis
If you are not accustomed to using automated indicators and prefer to watch and analyze manually, this three-moving-average strategy commonly used within the research institute is very suitable for you. It has a simple and clear logic, allowing for quick visual signal judgment.
This strategy uses only three EMA lines with parameters of 10, 40, 250. Sometimes, you can also use 120 instead of 250, making it suitable for medium to long-term trend trading. The signal rules are very easy to remember:
- When the price is above EMA250, and EMA10 crosses EMA40 from below to form a golden cross, that is a clear entry signal.
- If the price has just stabilized above EMA250 and a golden cross occurs near the moving average, that is the best bottom-hunting opportunity.
- The short entry signal is the complete opposite: when the price is below EMA250, enter when EMA10 crosses EMA40 downward.
Using HYPE as an example, this strategy can clearly signal an entry at the $42 level, allowing for full holding until the end of the trend, resulting in complete doubling of profits.
The World Cup is currently in full swing, here are some memes:


BTC, ETH, and other mainstream coins are also fully applicable, with very high accuracy in long-term trend signals.

Final Reminder: Avoid the Biggest Pitfall of EMA Strategies
Although the EMA strategy is useful, it is not infallible. Its biggest drawback is that it frequently triggers signals in a sideways market, leading to significant trading fees from back-and-forth buying and selling. This is why I have emphasized the importance of registering on OKX using my invitation code; a 20% trading fee rebate can save you a substantial amount, especially for friends trading on short timeframes, as it adds up to considerable savings over time.
If you encounter a clear sideways market, it is advisable to reduce trading activity or use other indicators such as RSI or Bollinger Bands to filter out false signals, and only use the EMA strategy for entry once a clear trend has emerged.
In summary, the EMA strategy is a powerful tool for capturing trends, with the bullish resonance strategy suitable for those who wish to automate trading, and the three-moving-average strategy ideal for those who enjoy manual analysis and medium to long-term approaches. You can first try these strategies on a demo account to see the effects and then fine-tune the parameters according to your trading style to find the rhythm that suits you best. By the way, there are several World Cup-themed meme coins with high discussion volumes on the OKX wallet recently, such as those related to the French team, Spanish team, and Argentine team. After binding your wallet, you can also look into them, but meme coins have higher risks, so be sure to participate with spare money and invest rationally.
This article only represents the author's personal views and does not represent the position or perspective of this platform. This article is for informational sharing only and does not constitute any investment advice for anyone.
免责声明:本文章仅代表作者个人观点,不代表本平台的立场和观点。本文章仅供信息分享,不构成对任何人的任何投资建议。用户与作者之间的任何争议,与本平台无关。如网页中刊载的文章或图片涉及侵权,请提供相关的权利证明和身份证明发送邮件到support@aicoin.com,本平台相关工作人员将会进行核查。