June 1 Market Analysis: Cycle Lines Conclude Together, Weak Market Pattern Continues
On June 1, 2026, entering a brand new June, the weekly K line and the monthly K line both completed their closing simultaneously, with multi-cycle technical patterns providing clear signals. Below is a detailed analysis of various categories.
1. Mainstream Cryptocurrencies (Bitcoin) Multi-Cycle Interpretation
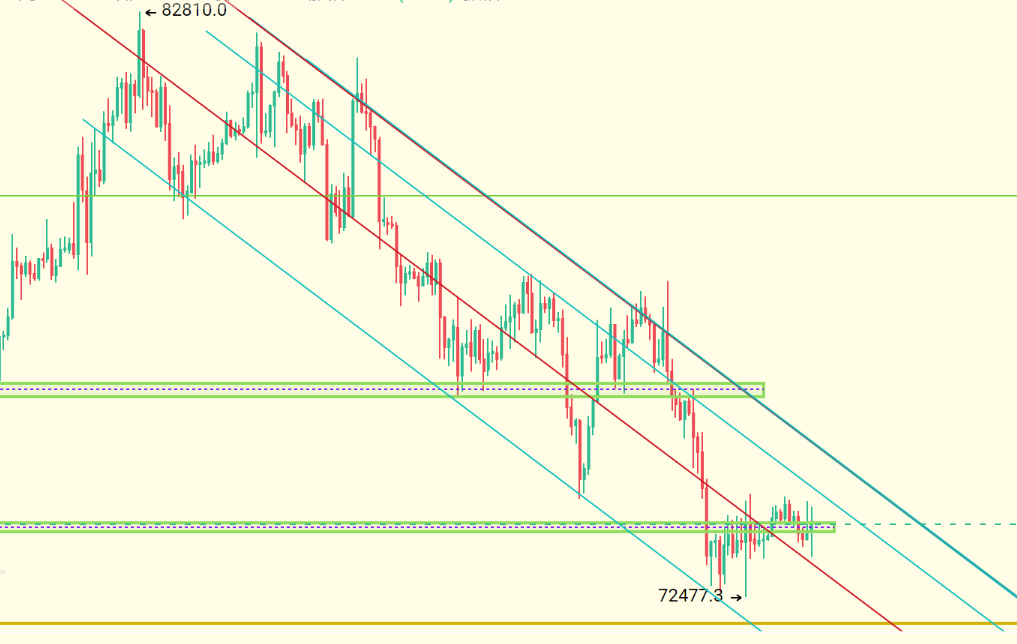
On the weekly chart, this week has formed a weak K line with relatively short upper and lower shadows. Currently, MA5 is at 76000, and MA20 is operating at 73100. 71000 is the core price level at present; this spot was previously an important resistance level, which has now transformed into a strong support for this phase.
The monthly line pattern displays an inverted hammer. After two consecutive months of rising, the market has corrected down from 82800, closing at 76300, with an intraday low reaching 72400. Currently, the monthly MA5 is at the 71700 position. Comprehensive judgment indicates that the range of 71000 to 72000, specifically around 71700, will become the core support zone for the subsequent market.
If the support areas of 71000 and 72000 are effectively broken, the market is likely to further retrace to 66000. This point is a previously well-established bottom area; if lost, the gains accumulated in March and April may face a deep correction. At this stage, it is recommended to maintain an observant stance.
The trend on the daily chart is also not optimistic. After the upward trend line was broken in mid-May, prices have continued to weaken. Since August 25, a complete downward trend line has formed, with current prices retreating to the vicinity of the 71000 support. The market has faced resistance after rising from 38000 to around 74000, then retreating again to 72000, maintaining a bearish trend. Coupled with the MACD indicator's diminishing momentum, the market’s weakening trend is very clear.
Based on the market levels, opportunities can be sought in the high range of 73500 to 74000.
2. Ethereum Market Analysis
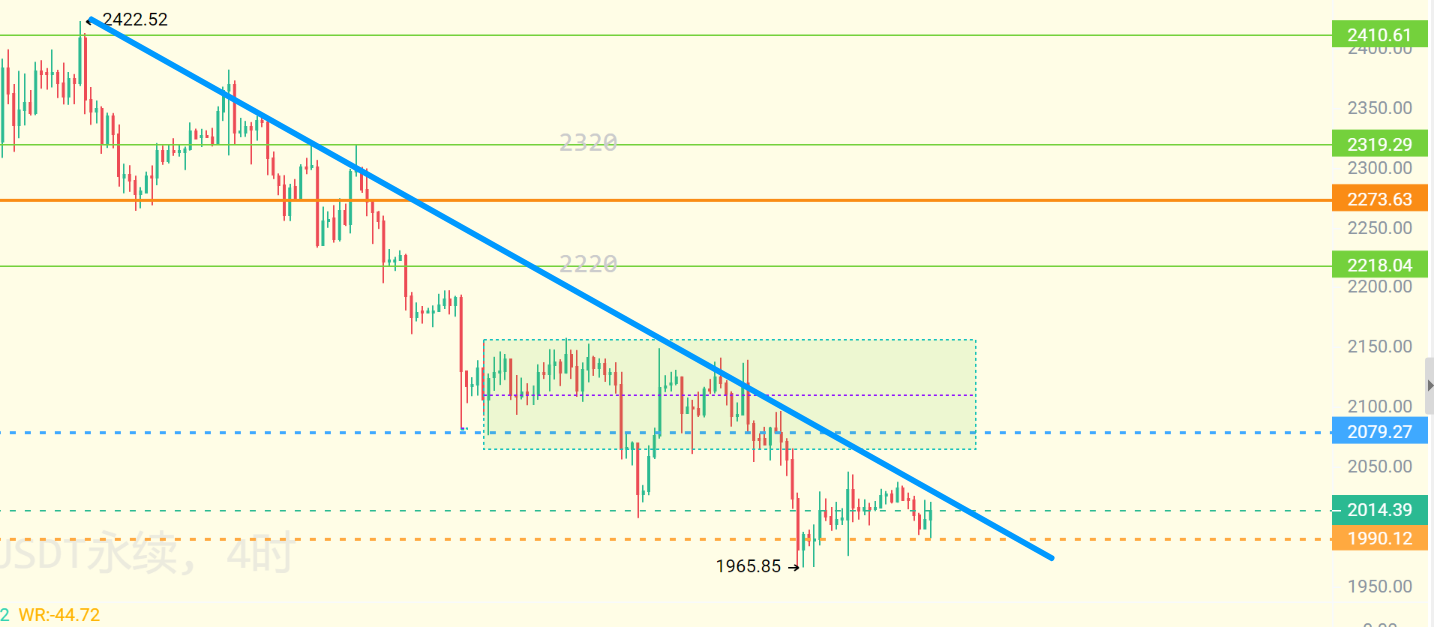
The overall trend for Ethereum remains sideways, with the current price at a relatively high level. The key resistance level above is at 2033, and trades can be considered in the 2022-2033 range.
3. Gold 4-Hour Market Analysis
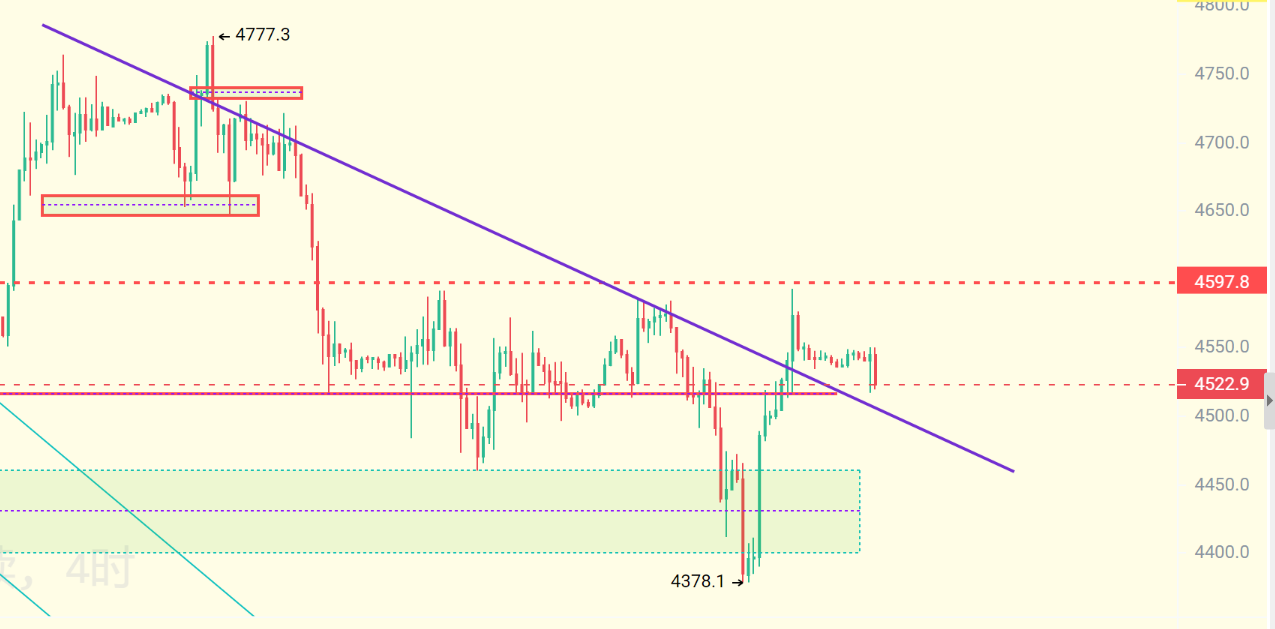
On the 4-hour cycle for gold, the price encountered significant pressure at the 4600 level and turned downward, operating along a downward trend line. An attempt to position at 4534 can be made, with a short-term target looking towards the 4510-4500 range.
If the key support line below is broken, the market will further dip to the 4400-4450 range. Currently, the market has long been in a fluctuating state, making it difficult to reach the 4800 level in the short term. Any rebound should be viewed as an opportunity for trend-based positioning. Currently, the line 2 has transformed into a support level, with prices likely rebounding to around 4600 based on support; subsequently, attention should be focused on the interplay between this resistance and the lower support.
4. Overall Strategy and Trading Summary
This month and this week continue to follow the previous trading strategy. Last week, overall trading achieved complete victory, with only 8 stop losses occurring within the twenty days from May 4 to May 29, resulting in favorable overall profit and loss performance.

免责声明:本文章仅代表作者个人观点,不代表本平台的立场和观点。本文章仅供信息分享,不构成对任何人的任何投资建议。用户与作者之间的任何争议,与本平台无关。如网页中刊载的文章或图片涉及侵权,请提供相关的权利证明和身份证明发送邮件到support@aicoin.com,本平台相关工作人员将会进行核查。