Dear friends, I am Sister Qinglan. This morning, the market sent two key signals. Bitcoin briefly broke through $74,000, and BNB returned to $700, which relieved many people. However, at the same time, the CEO of JPMorgan warned that stablecoins could crash, the probability of legislation passing has decreased, and regulatory uncertainty looms like a sword hanging overhead. These two news items, one positive and one negative, perfectly illustrate the current entangled state of the market. Bitcoin is oscillating between $73,000 and $74,000, with both bulls and bears waiting for a clear breakout. Let's get straight to the point and let the data do the talking.
Current Price and Time
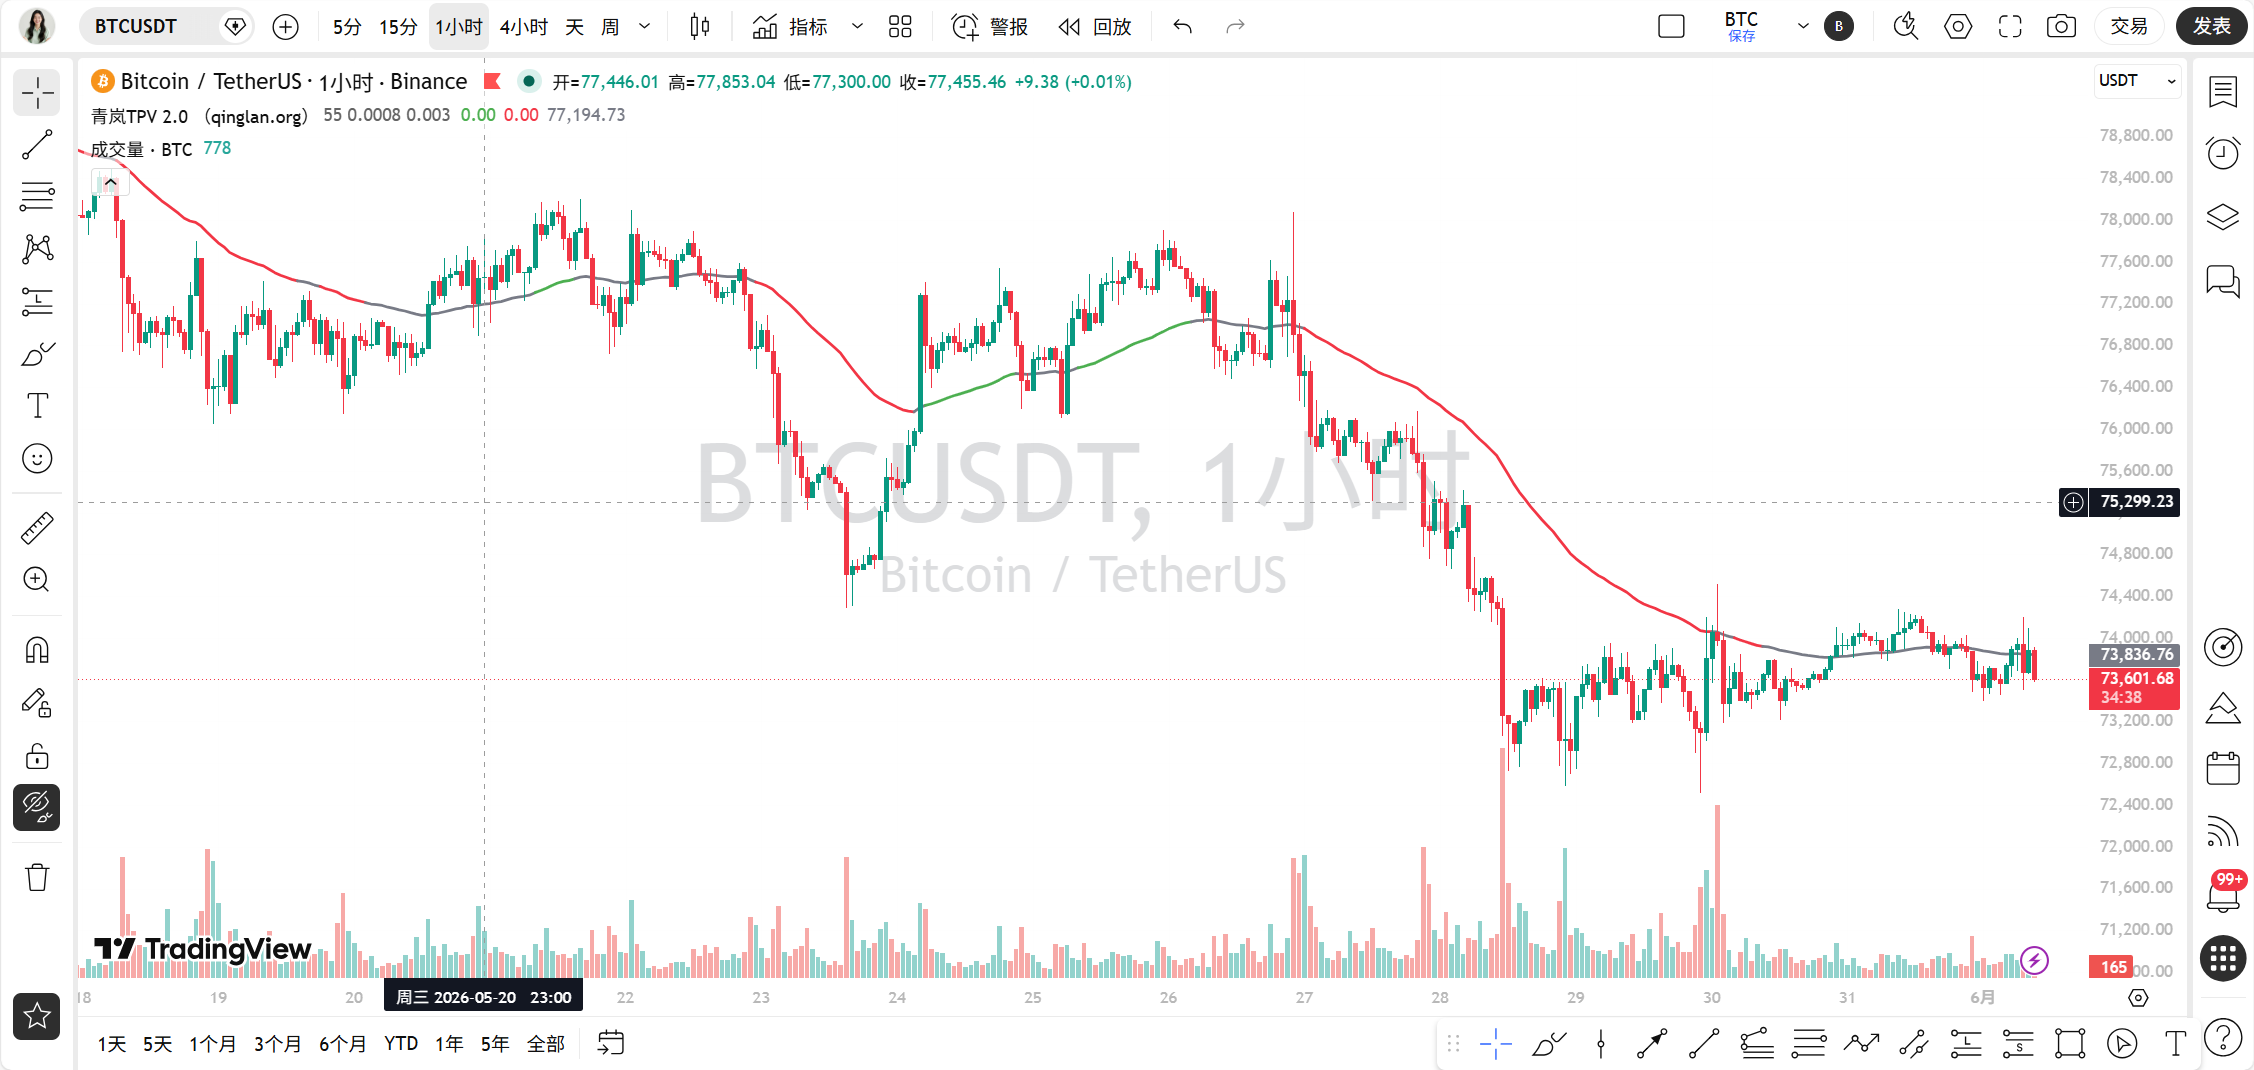
It is currently June 01, 09:25, and Bitcoin is priced at 73,636 USDT. The 24-hour drop is 0.28%, and the fear and greed index is only 28, indicating an extreme fear zone. This position is neither high nor low, but a typical oscillation center. The market share is 57.27%, indicating that funds are circulating within Bitcoin without a large-scale flow into altcoins.
Multi-Cycle Status Overview
First, let's look at the daily line. MA5 is at 73,654, MA10 is at 74,979, and MA30 is at 77,852, with the moving average system in a bearish arrangement. The MACD's DIF is -1,148, DEA is -689, and the histogram is -458, with the death cross status continuing. The RSI is only 31.98, close to the oversold area. The daily line clearly shows a bearish trend, but the low RSI indicates that the downward momentum may be nearing exhaustion.
On the 4-hour level. MA5 is at 73,693, MA10 is at 73,831, MA30 is at 73,897, and the price is running below the moving averages. The MACD's DIF is -303, DEA is -394, and the histogram is 90. Although the DIF is still below the zero axis, the histogram has turned positive, indicating a weakening of bearish momentum. The RSI is 53.07, returning to the neutral zone. The 4-hour chart shows signs of stabilization, but a reversal has not yet formed.
On the 1-hour level. MA5 is at 73,806, MA10 is at 73,717, and MA30 is at 73,869, with the price tangled between MA5 and MA10. The MACD's DIF is -32, DEA is -29, and the histogram is -2.45, in a death cross state. The RSI is at 42.29, indicating weakness. EMA55 is at 73,780, and the current price of 73,636 is below EMA55, indicating a bearish area.
On the 15-minute level. MA5 is at 73,799, MA10 is at 73,783, and MA30 is at 73,733, with the price oscillating near the moving averages. The MACD's DIF is 7.96, DEA is 28.78, and the histogram is -20.82, with no cross. The RSI is at 39.96, showing weakness. The 15-minute chart has no clear direction, just following the fluctuations of the larger cycles.
In summary: the daily line is bearish, the 4-hour line is stabilizing, the 1-hour line is bearish, and the 15-minute line is oscillating. The multi-cycle does not resonate, which is typical of oscillation market characteristics.
TPV Signal Verification
Now let's use the Qinglan TPV system for verification. The core rule is that the 1-hour EMA55 serves as the boundary between bulls and bears. The current price is 73,636, which is below EMA55 at 73,780, so the trend is positioned in a bearish area.
Short-selling conditions require three simultaneous satisfactions. First, the price is under pressure below the 1-hour EMA55. In the past 8 one-hour candlesticks, the number of times the closing price was above EMA55 is 3, while below EMA55 is 5, and it crossed 4 times. The current price's absolute distance from EMA55 is only 0.20%, indicating proximity to the line. Thus, condition one is satisfied; the price is indeed below EMA55.
Second, pressure meets resistance. We need to check for long upper shadows or top formations. From the one-hour candlesticks, the most recent candlestick is a bearish one, with a very short upper shadow and no obvious top formation. However, the price has repeatedly crossed near EMA55, indicating that there is indeed pressure here.
Third, the rebound is weak. Has the MACD histogram shortened for 2 consecutive periods? The current one-hour MACD histogram is -2.45, the previous one is -3.12, and the one before that is -4.01, showing a definite reduction. The RSI has risen from 42.29, but has yet to exceed 70. Thus, condition three is partially satisfied.
However, there is a key issue here. The oscillation auxiliary data clearly indicates that in the past 8 one-hour candlesticks, the closing price was above EMA55 3 times, crossed 4 times, and the price's distance from EMA55 is 0.20%, fully complying with the oscillation determination threshold. According to the TPV system, in an oscillation market, one does not actively seek to go long or short, but only trades within the range. Therefore, the current signal is oscillation, not a clear bearish signal.
On-chain Funding Situation
The fear and greed index is 28, indicating extreme fear. This figure typically means market sentiment is pessimistic to the extreme, which could potentially signal a bottom area. However, it is important to note that extreme fear does not necessarily indicate an immediate reversal and may persist for a while. Stablecoin outflow is $1.2 billion, indicating that funds are fleeing, which is not a good signal. On the other hand, Michael Saylor hinted that he might announce increased Bitcoin holdings next week, and institutional accumulation expectations may provide support. Overall, the funding situation is slightly bearish, but there are positive expectations.
Key Offensive and Defensive Levels
The first resistance level above is the 1-hour EMA55 at 73,780, which has been tested multiple times today. If broken, the next resistance level is the 4-hour MA10 at 73,831, then the 1-hour MA30 at 73,869. Further up, $75,000 is a psychological barrier; once broken, the intensity of short liquidation could reach $453 million, possibly triggering a short squeeze.
The first support level below is $73,000, which is a key level recognized by the market. If it breaks, the next support is $71,400, and analysts believe that holding this position could lead to a rebound to $78,200. Further down, the psychological support is at the integer level of $70,000.
Trading Thoughts
Based on the oscillation determination of the TPV system, currently, do not actively go long or short, just engage in range trading.
Direction: oscillating range, sell high and buy low.
Entry Conditions: If the price rebounds to the area of $73,800 to $73,900 and shows a long upper shadow or a top formation, a light short position can be taken. If the price retraces to the area of $73,200 to $73,300 and shows a long lower shadow or a bottom formation, a light long position can be taken. Note, it must be a clear shape signal, do not chase highs or panic sell.
Stop Loss: Place the short-stop loss above $74,050, and the long-stop loss below $73,000. In oscillating markets, stop losses must be tight to prevent false breakthroughs.
Target: For short, aim for $73,300 to $73,400; for long, aim for $73,700 to $73,800. In an oscillation market, do not be greedy; take profits when they are there.
If the price breaks $74,050 and stabilizes, the oscillation pattern could turn bullish, allowing for long positions with a target of $74,500. If the price breaks below $73,000, the oscillation pattern could turn bearish, allowing for short positions with a target of $72,000.
Risk Warning
In an oscillation market, false breakthroughs are frequent, so strict stop losses are necessary, and positions should be controlled within 5%.
Follow Qinglan Crypto Class for more trading opportunities! Feel free to visit the official website www.qinglan.org
📊 Qinglan TPV Trading Strategy Backtest Reference
🕒 Last backtest time 06-01 07:00:02
Total analysis: 1933 Backtests: 1629 Accuracy rate: 67.5% (1099/1629)
免责声明:本文章仅代表作者个人观点,不代表本平台的立场和观点。本文章仅供信息分享,不构成对任何人的任何投资建议。用户与作者之间的任何争议,与本平台无关。如网页中刊载的文章或图片涉及侵权,请提供相关的权利证明和身份证明发送邮件到support@aicoin.com,本平台相关工作人员将会进行核查。