Wave Riding in the Crypto Sea: June 1 Bitcoin (BTC) Market Analysis Reference:
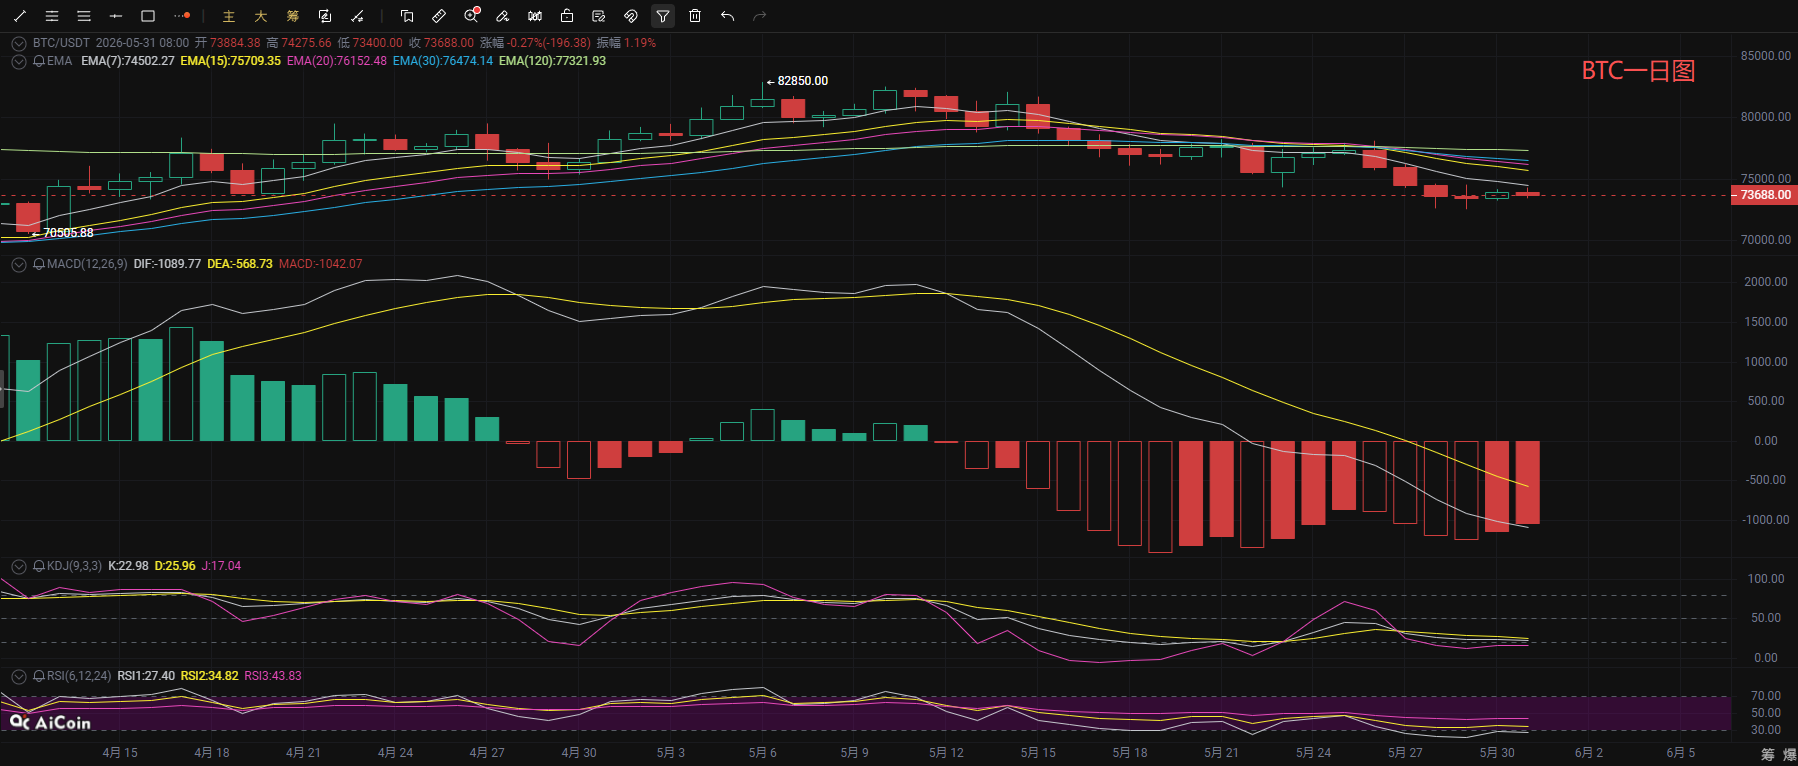
The current price of Bitcoin is 73,700, and at the daily level, it is still in a downtrend, with prices continuously under pressure from the middle band of the Bollinger Bands. The moving average system (EMA7/15/20/30) is arranged in a bearish alignment, heavily suppressing the price. The MACD indicator shows that the DIF and DEA are still operating below the zero axis; although negative momentum has not further expanded, the trend dominated by bears has not fundamentally changed. The KDJ indicator's K and D values are both in the oversold area around 25, showing slight signs of a turn, while the RSI indicators across various periods are also in a weak zone, indicating that the short-term bearish strength is weakening, but an effective reversal signal has not yet formed. Overall, the daily level is still in a weak bottoming stage; if the price cannot effectively stabilize above 74,500, downward risks remain, with key support at the previous low of 72,500. A breach of this level could open a new round of declines.
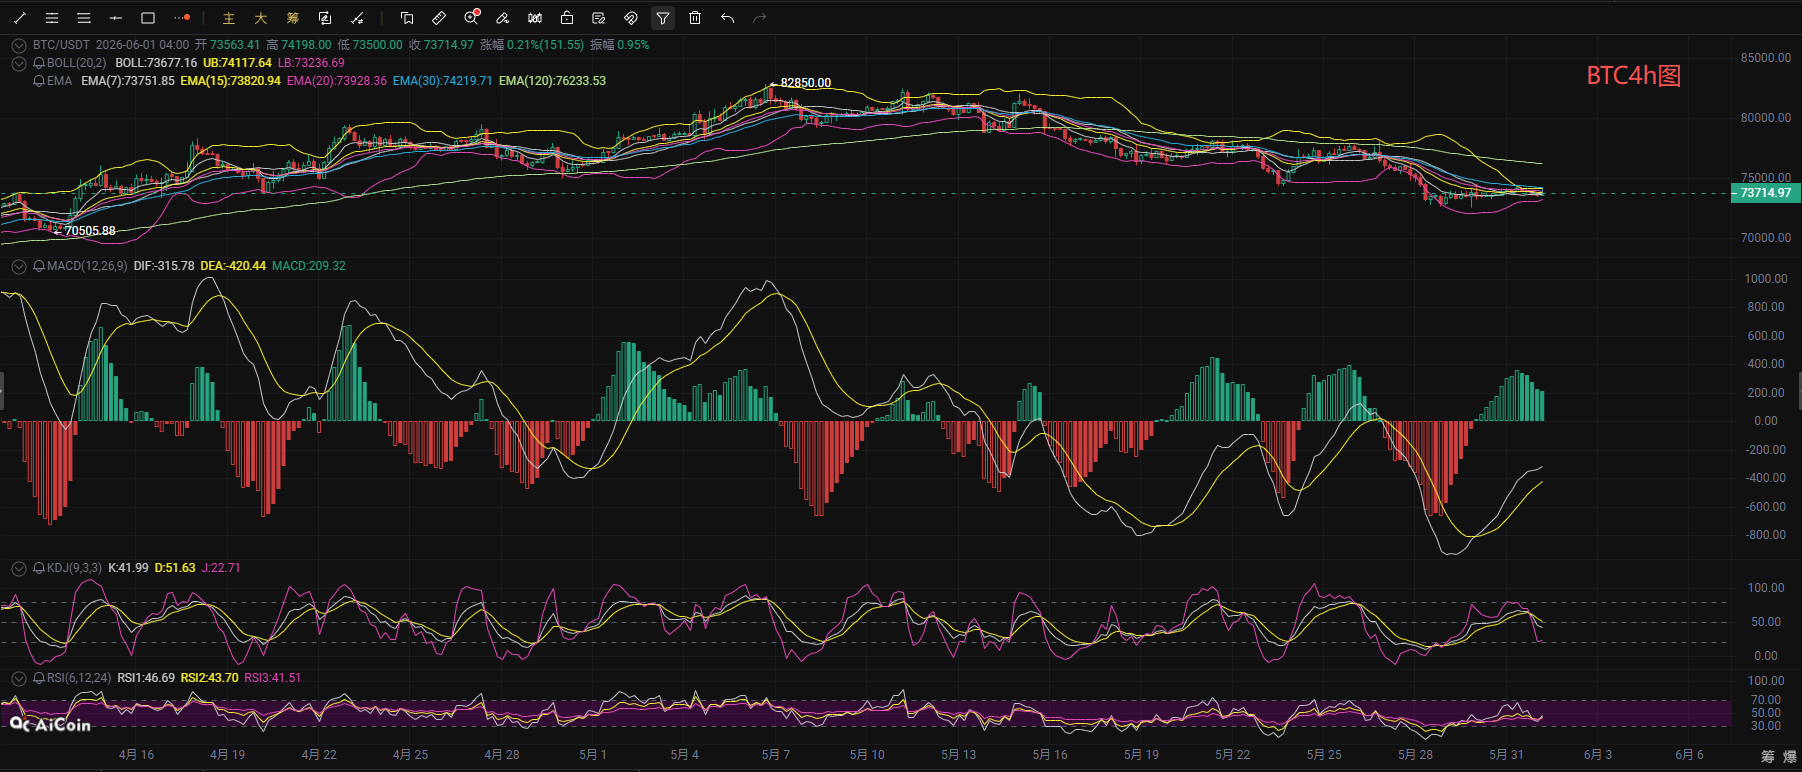
The short-term 4-hour level is currently still in a low-level oscillation and repair stage, with prices trading in a narrow range around 73,500, under pressure from the middle band of the Bollinger Bands and EMA moving averages. Key resistance is concentrated in the range of 74,000-74,200, while support is at 73,200 and the previous low. The MACD indicator maintains a positive value, but momentum has visibly weakened, with the DIF and DEA still below the zero axis, indicating that the current rebound is merely a weak correction within a bearish trend, without forming a trend reversal; the KDJ indicator's K line has retreated to around 35, again approaching the neutral zone, and the RSI indicators across various periods have also fallen to around 40, showing a retreat of short-term bullish strength. Overall, the 4-hour level currently shows insufficient rebound momentum, and prices are likely to continue to oscillate within the range. If it cannot break through the resistance zone of 74,200-74,500 with increased volume, bearish strength may dominate the trend again, and if the lower support is breached, it will test the 72,500 level again. In terms of operation, it is advisable to treat it with a range mindset: if under pressure in the resistance zone, consider shorting to anticipate a fall; after the price stabilizes at key support levels, look for opportunities to enter long positions, while also setting stop losses to guard against risks of breaking below support.
Wave Riding in the Crypto Sea: June 1 Bitcoin Short-Term Reference:
Long Position: Long in the 72,500-73,200 range, with a stop loss of 500 points, targeting 73,500-74,500,
Short Position: Short in the 75,300-74,500 range, with a stop loss of 500 points, targeting 74,000-73,000,
[The above analysis and strategy are for reference only; risks are to be borne by the reader. The publication of the article may be delayed, and the strategies may lack timeliness; do not operate blindly.]

The content of this article is shared by [Wave Riding in the Crypto Sea], representing only personal opinions. Article dissemination has delays; for reference only, do not operate blindly! Want to get more daily real-time trades? Then follow my public account! Here, you can engage in online technical learning and also learn about related knowledge for cutting losses and exiting positions. I have years of research experience in the market, focusing on major trends in the crypto space. I am primarily responsible for analyzing and guiding investment operations for BTC, ETH, SOL, BCH, and other currencies. Welcome to research and study together.
免责声明:本文章仅代表作者个人观点,不代表本平台的立场和观点。本文章仅供信息分享,不构成对任何人的任何投资建议。用户与作者之间的任何争议,与本平台无关。如网页中刊载的文章或图片涉及侵权,请提供相关的权利证明和身份证明发送邮件到support@aicoin.com,本平台相关工作人员将会进行核查。