Cryptocurrency Circle Academician: The downward pattern of Bitcoin on the daily chart at 6.1 remains unchanged, the four-hour chart is consolidating, when will the turning point for Bitcoin appear? Latest market analysis and operational suggestions
The current price of Bitcoin is 73,500. It's been half a year since June 1; how have everyone's results been during this half year? I reviewed the performance of the past six months, and it’s only seven times, which is far from the expectation. However, the friends I met in the cryptocurrency community all seem frustrated, afraid of catching the falling knife when chasing high prices, and worried about being trapped when trying to buy low. Everyone should review what I said and suggested; if anyone had listened just once, we wouldn't be in the situation we are today. At this moment, the north-south logic of the market is clear, where to enter and where to avoid risks; I have laid this out for you, choose after reading.
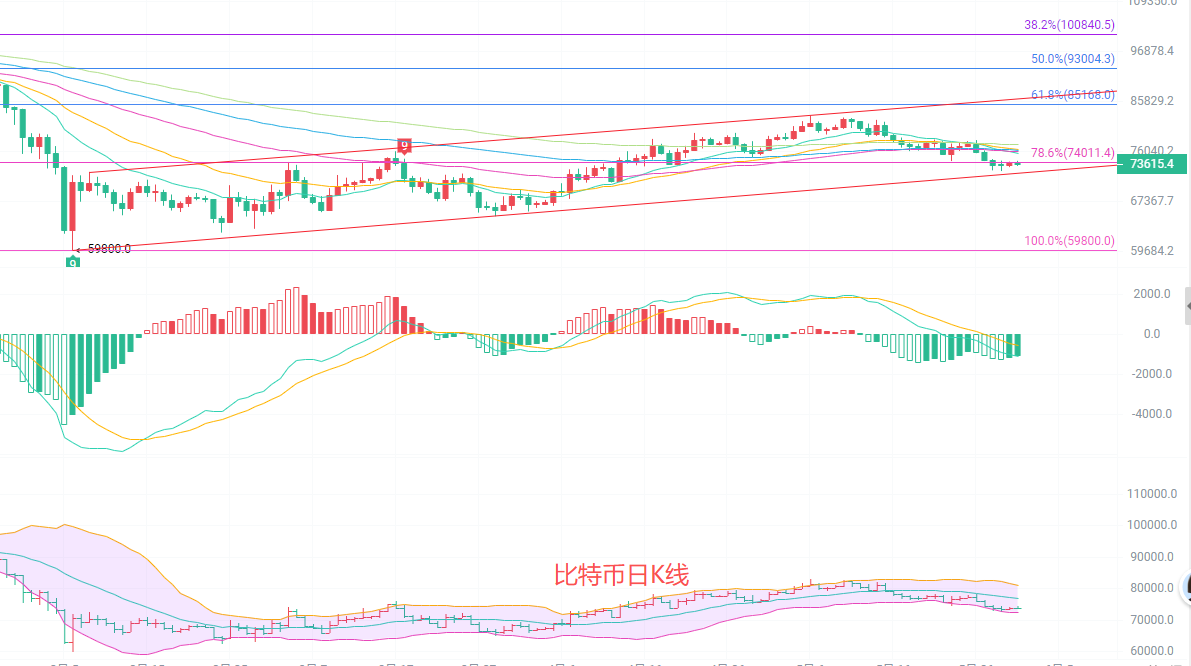
The daily candlestick chart is below the EMA15/30, with moving averages displaying a downward arrangement, indicating a long-term trend under pressure. In the MACD indicator, the DIF is still below the DEA, with small green bars slightly shrinking. Although the downward momentum has weakened, it has not completely reversed. The Bollinger Bands are continuously narrowing, and the price is running close to the lower band, with the upper band pressure around 81,100 and the lower band support near 72,400. Recently, the trading volume has been moderate, and there is a strong wait-and-see sentiment in the market, with no clear reversal signal appearing. In the short term, the market is still predominantly weak and volatile, and we need to pay attention to whether it can stand above the EMA15.
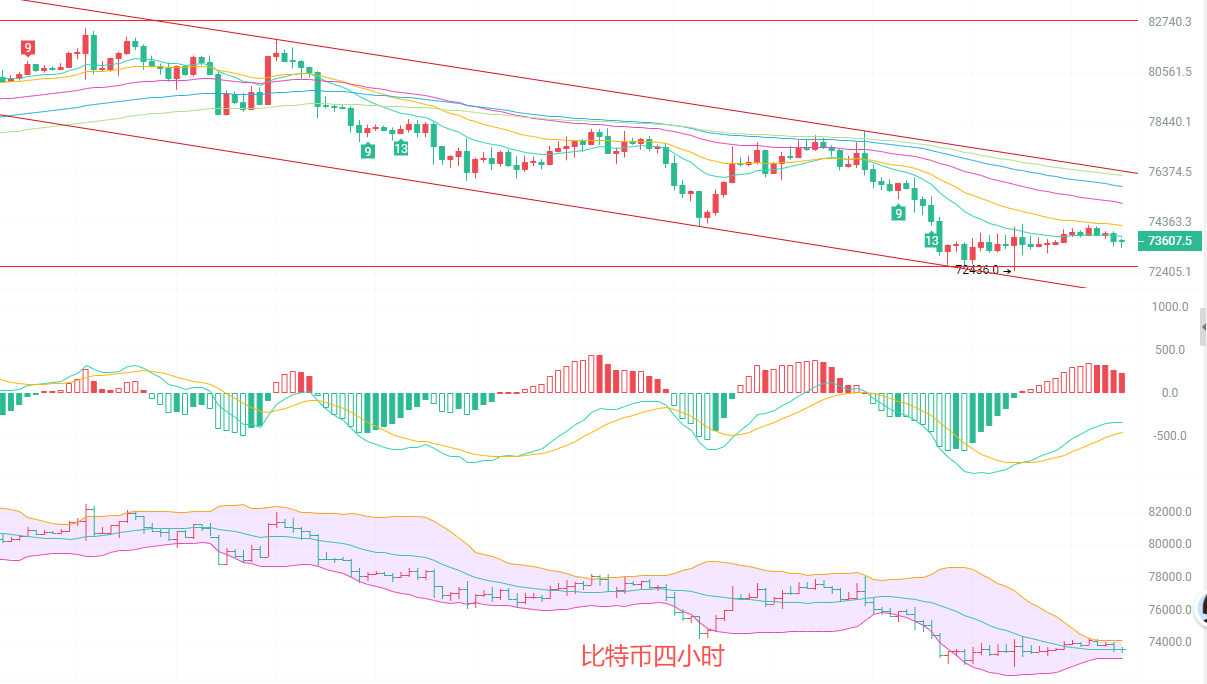
The four-hour candlestick chart has entered a low-level sideways consolidation phase. The current price is oscillating near the EMA15/30, short-term moving averages are flattening, and the long-term EMA120 is forming resistance above. The MACD indicator shows the DIF crossing above the DEA with a continuous increase in red bars, indicating a release of short-term rebound momentum. The Bollinger Bands have narrowed and are leveling off, with the price running near the middle band, upper band pressure at 74,150, and lower band support at 73,060. Overall, the four-hour chart is in a weak rebound, with limited rebound strength and dense moving average resistance above, making it difficult to change the sideways pattern in the short term.
Short-term trading strategy reference: Follow the trend of the larger cycle, with small stop losses and quick in-and-out.
Buy from 73,200 to 72,700, with a stop loss at 72,200, targeting 74,500 to 75,000.
Sell from 74,500 to 75,000, with a stop loss at 75,500, targeting 74,000 to 73,000.
Specific operations should primarily depend on real-time market data; for more information, you can consult the author. The article is published with a delay; the suggestions are for reference only and the risks are borne by yourself.


Kind reminder: The above content is solely created by the author, and the advertisements at the end of the article and in the comment section are unrelated to the author. Please identify carefully, and thank you for reading.
免责声明:本文章仅代表作者个人观点,不代表本平台的立场和观点。本文章仅供信息分享,不构成对任何人的任何投资建议。用户与作者之间的任何争议,与本平台无关。如网页中刊载的文章或图片涉及侵权,请提供相关的权利证明和身份证明发送邮件到support@aicoin.com,本平台相关工作人员将会进行核查。