Dear friends, I am Sister Qinglan. Early this morning, the market welcomed two major announcements, which directly ignited the enthusiasm of the bulls. First, the U.S. CFTC officially lifted the ban on cryptocurrency perpetual contracts, which means the doors of the U.S. market are open to crypto derivatives, significantly enhancing liquidity expectations, signaling strong bullish sentiment. Second, Bitcoin successfully broke through the $74,000 mark, with a 24-hour increase of 1.3%, creating a resonance between technical and fundamental factors. These two pieces of news combined quickly warmed up market sentiment from extreme fear, but we need to calmly analyze the sustainability of this upward trend.
Current Price and Time
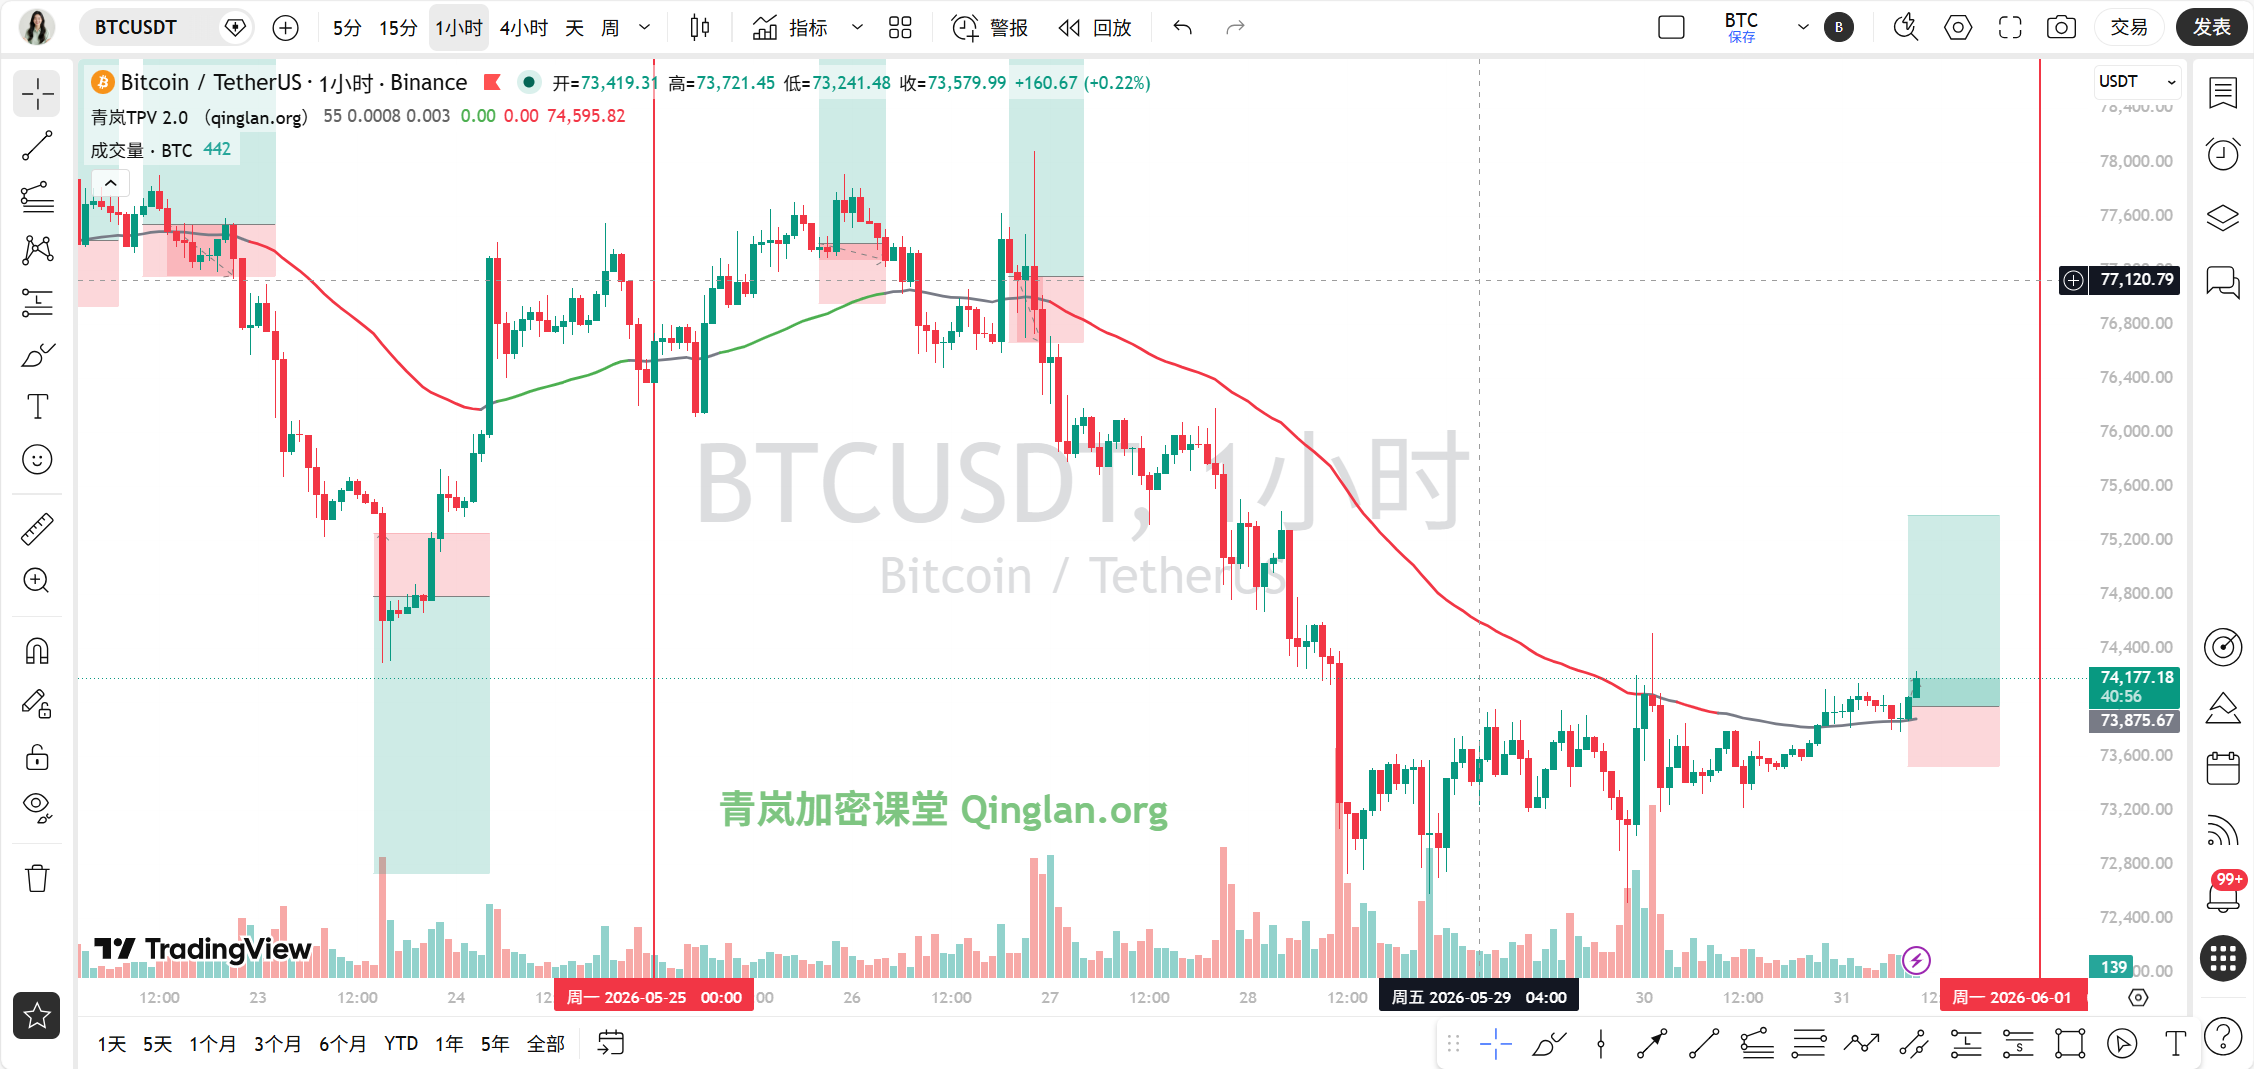
The current time is May 31, 2026, 09:18, and the Bitcoin quote is 74177 USDT. The 24-hour increase is 0.58%, and the market shows a high-level oscillation pattern after breaking through. The Fear and Greed Index is only 23, indicating extreme fear, showing that retail investor sentiment has not yet fully turned optimistic, which is often a potential support for market continuation.
Multi-Cycle Status Overview
Let's look at the technical status of each cycle. On the daily level, MA5 is at 73917, MA10 is at 75219, MA30 is at 78037, with the price above the short-term moving averages but below the long-term moving averages. The MACD column is negative at -488.37, and the RSI is at 33.33, indicating that the daily level is still in the bearish repair phase, but the downward momentum is weakening. On the 4-hour level, MA5 and MA10 form a golden cross around 73922 and 73747. The MACD column is positive at 178.47, and the RSI has risen to 65.59, indicating that the medium-term trend is strengthening. On the hourly level, MA5 and MA10 are converging around 73993 and 73996, the MACD column is at 17.43, and the RSI has reached 81.97, close to the overbought area, indicating short-term pullback pressure. On the 15-minute level, MA5 and MA10 are around 74054 and 73952, the MACD column is at 29.41, and the RSI is at 62.67, showing that the short-term momentum is still present but has slowed down. Overall, the multi-cycle presents a pattern of short strong, medium stable, and long weak, requiring attention to the overbought risk on the hourly level.
TPV Signal Verification
According to the Qinglan TPV system, we use the 1-hour EMA55 as the boundary between bulls and bears, with the current EMA55 value at 73812.90. The current price of 74177 is obviously above EMA55, and all of the last 8 one-hour candlesticks closed above EMA55, with crossing times at 0, not satisfying the oscillation conditions, thus belonging to a one-sided bullish trend area.
Bullish Conditions Verification: First, the price stabilizes above the 1H EMA55, with 8 consecutive candlesticks closing above EMA55, conditions satisfied. Second, in terms of support stabilization, the price showed a slight pullback after breaking 74000 but did not drop below EMA55, and there is long lower shadow support on the 15-minute level, conditions satisfied. Third, regarding the exhaustion of downward momentum, the 1-hour MACD column has been continuously positive and expanding, with RSI rising from below 30 to 81, but it should be noted that RSI has entered the overbought zone, and momentum may weaken. In summary, the bullish trend is clear, but short-term overbought needs to watch out for pullbacks.
Bearish Conditions Verification: The current price is far above EMA55, not meeting short-selling conditions. In terms of oscillating market handling: the closing prices of the last 8 candlesticks are all above EMA55, crossing times at 0, with the price and EMA55 amplitude at 0.49%, greater than 0.3%, not meeting oscillation threshold, therefore inapplicable to range strategy.
On-chain and Funding Overview
In terms of on-chain data, the Fear and Greed Index is at 23, which indicates extreme fear, typically meaning the market is at a bottom or in the early stages of a rise, and retail investors are not yet panicking. The BTC market share is at 57.32%, showing Bitcoin's dominant position is solid. On the funding side, the inflow of stablecoins from Binance's whales has halved, and large capital is withdrawing, which may suggest some whales are reducing their positions or observing, but the positive news from the CFTC ban lift may attract new capital into the market. Overall, funding appears cautious but is supported by favorable expectations.
Key Support and Resistance Levels
The current key support level is around 73812, the 1-hour EMA55, which is the boundary between bulls and bears; breaking below it would weaken the trend. The upper resistance levels are at the daily MA10 at 75219 and MA30 at 78037, which is a medium-term pressure zone. The short-term resistance level is around 74500, which is a previous high. The lower support level is at the psychological support of the 73000 integer. If the price pulls back to EMA55 without breaking it, the bulls will continue; if it breaks down, it may test 73000.
Trading Ideas
Direction: The bullish trend is clear, but it's overbought in the short term, suggesting waiting for a pullback to go long, rather than chasing high prices.
Entry Conditions: Wait for the price to pull back near the 1-hour EMA55, in the 73800-73900 range, while meeting the following conditions: the closing price of the 1-hour candlestick stabilizes above EMA55, and the MACD column contracts for 2 consecutive periods before expanding again, or RSI falls below 70 from the overbought area. If the price directly breaks through 74500 and stabilizes, a light position can be taken to go long, but strict stop-loss is required.
Stop-Loss Level: After entry, set the stop-loss at 73600, about 200 points below EMA55, to prevent false breaks. If entering by chasing the high, set the stop-loss below 74000.
Target Levels: The first target is 74500, the second target is 75200, and the third target is 78000. Take profit in batches and move the stop-loss to protect profits.
Risk Warning
Short-term overbought RSI may trigger pullbacks; after CFTC's favorable news materializes, be cautious of profit-taking pressure, suggesting light position trading and strict stop-loss.
Follow the Qinglan Crypto Classroom to grasp more trading opportunities! Welcome to visit the official website www.qinglan.org
📊 Qinglan TPV Trading Strategy Backtest Reference
🕒 Last Backtest Time 05-31 07:00:02
Total Analysis: 1909 Backtests: 1627 Accuracy: 67.4% (1097/1627)
免责声明:本文章仅代表作者个人观点,不代表本平台的立场和观点。本文章仅供信息分享,不构成对任何人的任何投资建议。用户与作者之间的任何争议,与本平台无关。如网页中刊载的文章或图片涉及侵权,请提供相关的权利证明和身份证明发送邮件到support@aicoin.com,本平台相关工作人员将会进行核查。