Many people think that writing indicators is the programmer's job, but in fact, there is no need to be afraid. Writing indicators essentially means breaking down the rules you usually use to analyze charts into steps that can be executed by a system, achieving a combination of human and machine. Today’s lesson is like a physical training class; there is no need to memorize functions. As long as you can achieve three things by the end, you will meet the standard: First, understand what the indicator is really helping you with; Second, be able to identify which part of the code is responsible for calculation, which part is responsible for judgment, and which part is responsible for display; Third, be able to modify the indicator’s period, color, text, and alert title by yourself.
Let’s clarify first: all the content today is about teaching how to write indicators and does not constitute any investment advice. Indicators are just auxiliary tools, not guarantees of profit.
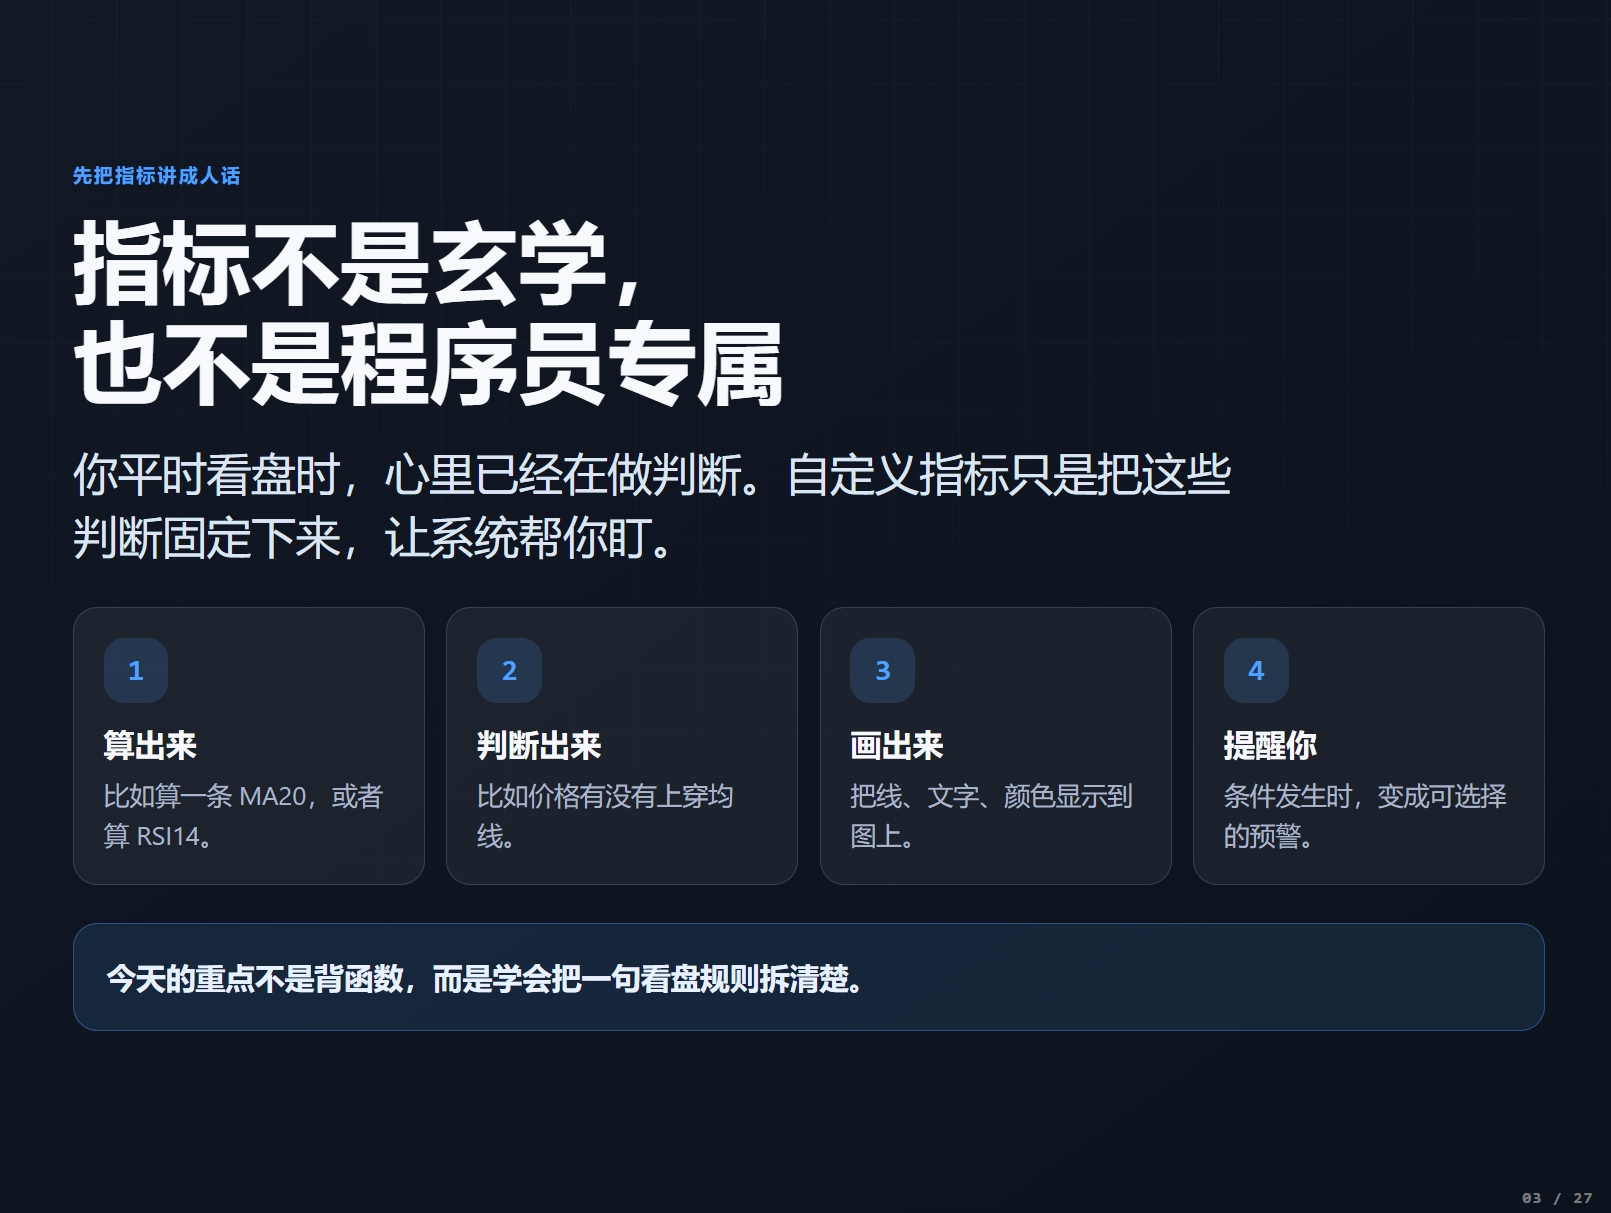 Many people find indicators mysterious, and the dense code can be overwhelming, but actually, when you analyze the market, you are already unconsciously making indicator judgments. For example, you might think, "Is the price above the 20-day moving average?", "Is the RSI above 70, indicating overbought conditions?", or "Do the two moving averages have a golden cross?" These judgments can easily be overlooked with the naked eye. The role of custom indicators is to write down these rules so that the system can monitor them for you 24/7.
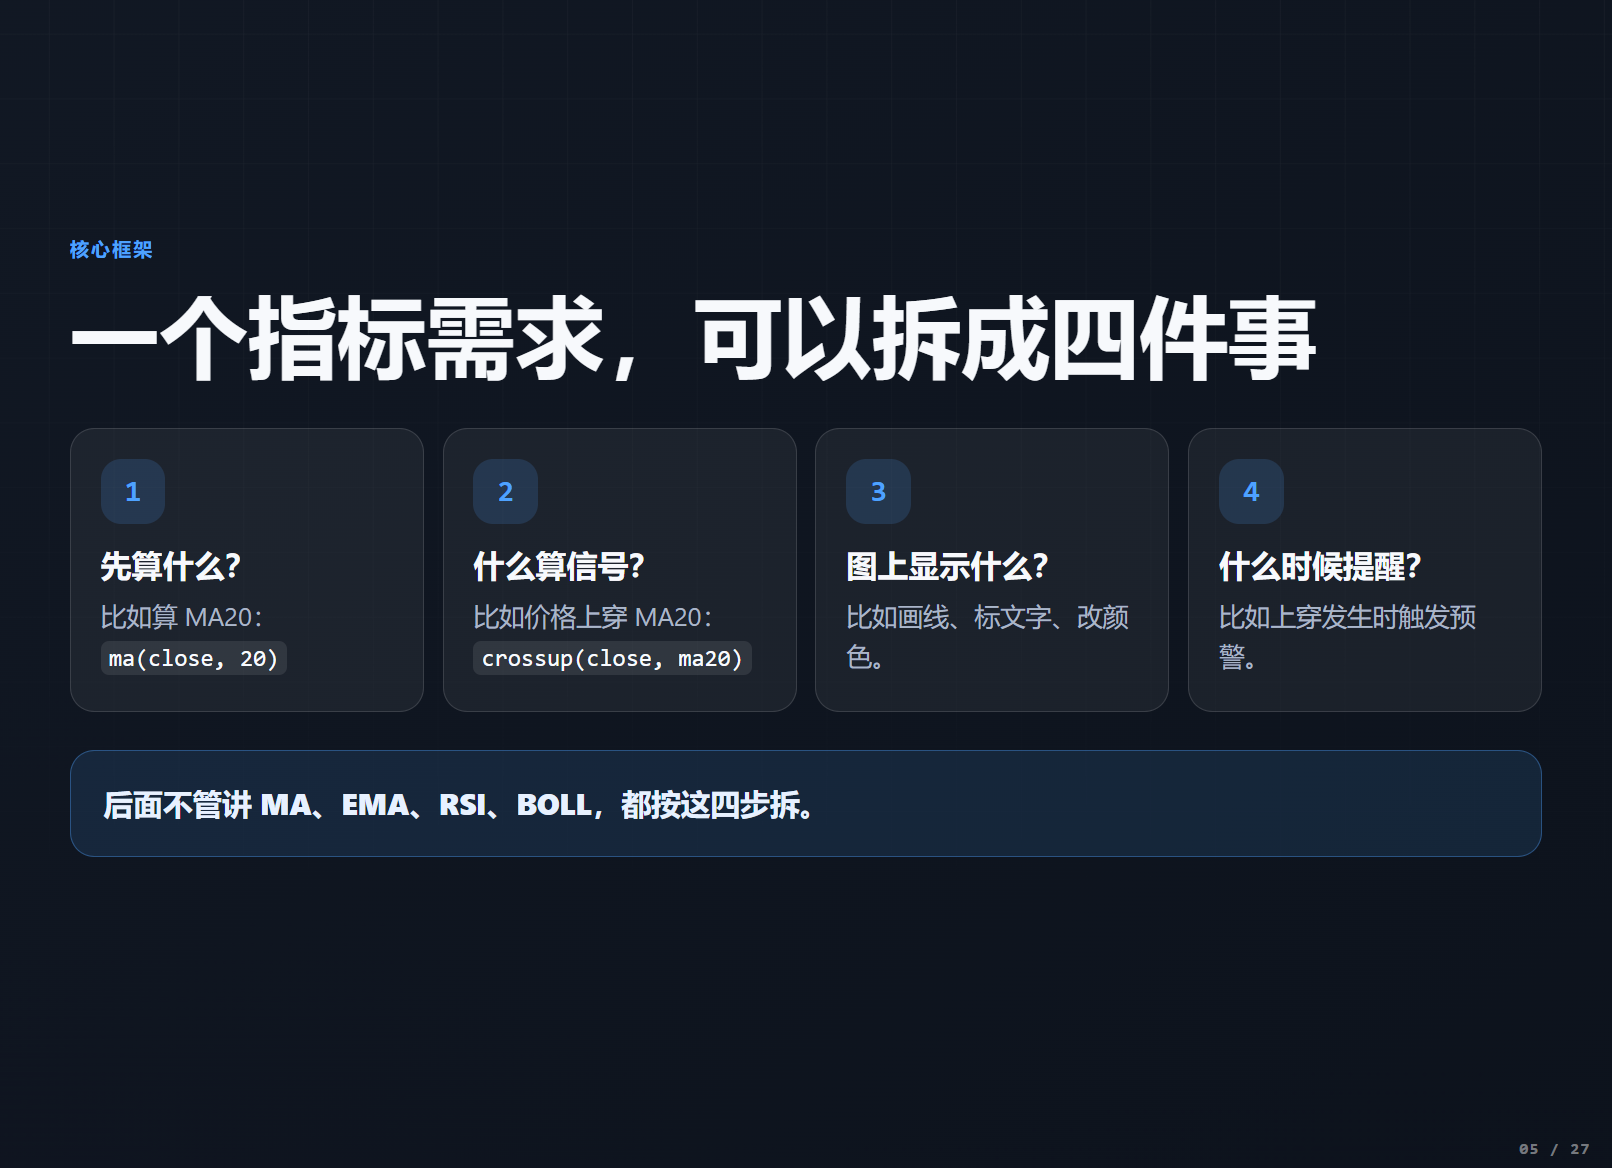
A complete indicator always does four things:
- Calculate: Calculate the values you need, such as the 20-day moving average or the 14-day RSI.
- Judge: Set triggering conditions, like the price crossing above the moving average or RSI being below 30.
- Plot: Display lines, text, and icons on the candlestick chart.
- Alert: Send alerts when conditions are triggered so you don’t have to constantly watch the charts.
All the content today revolves around this four-step framework. No matter how complex the indicator is, it can be broken down into these four steps.
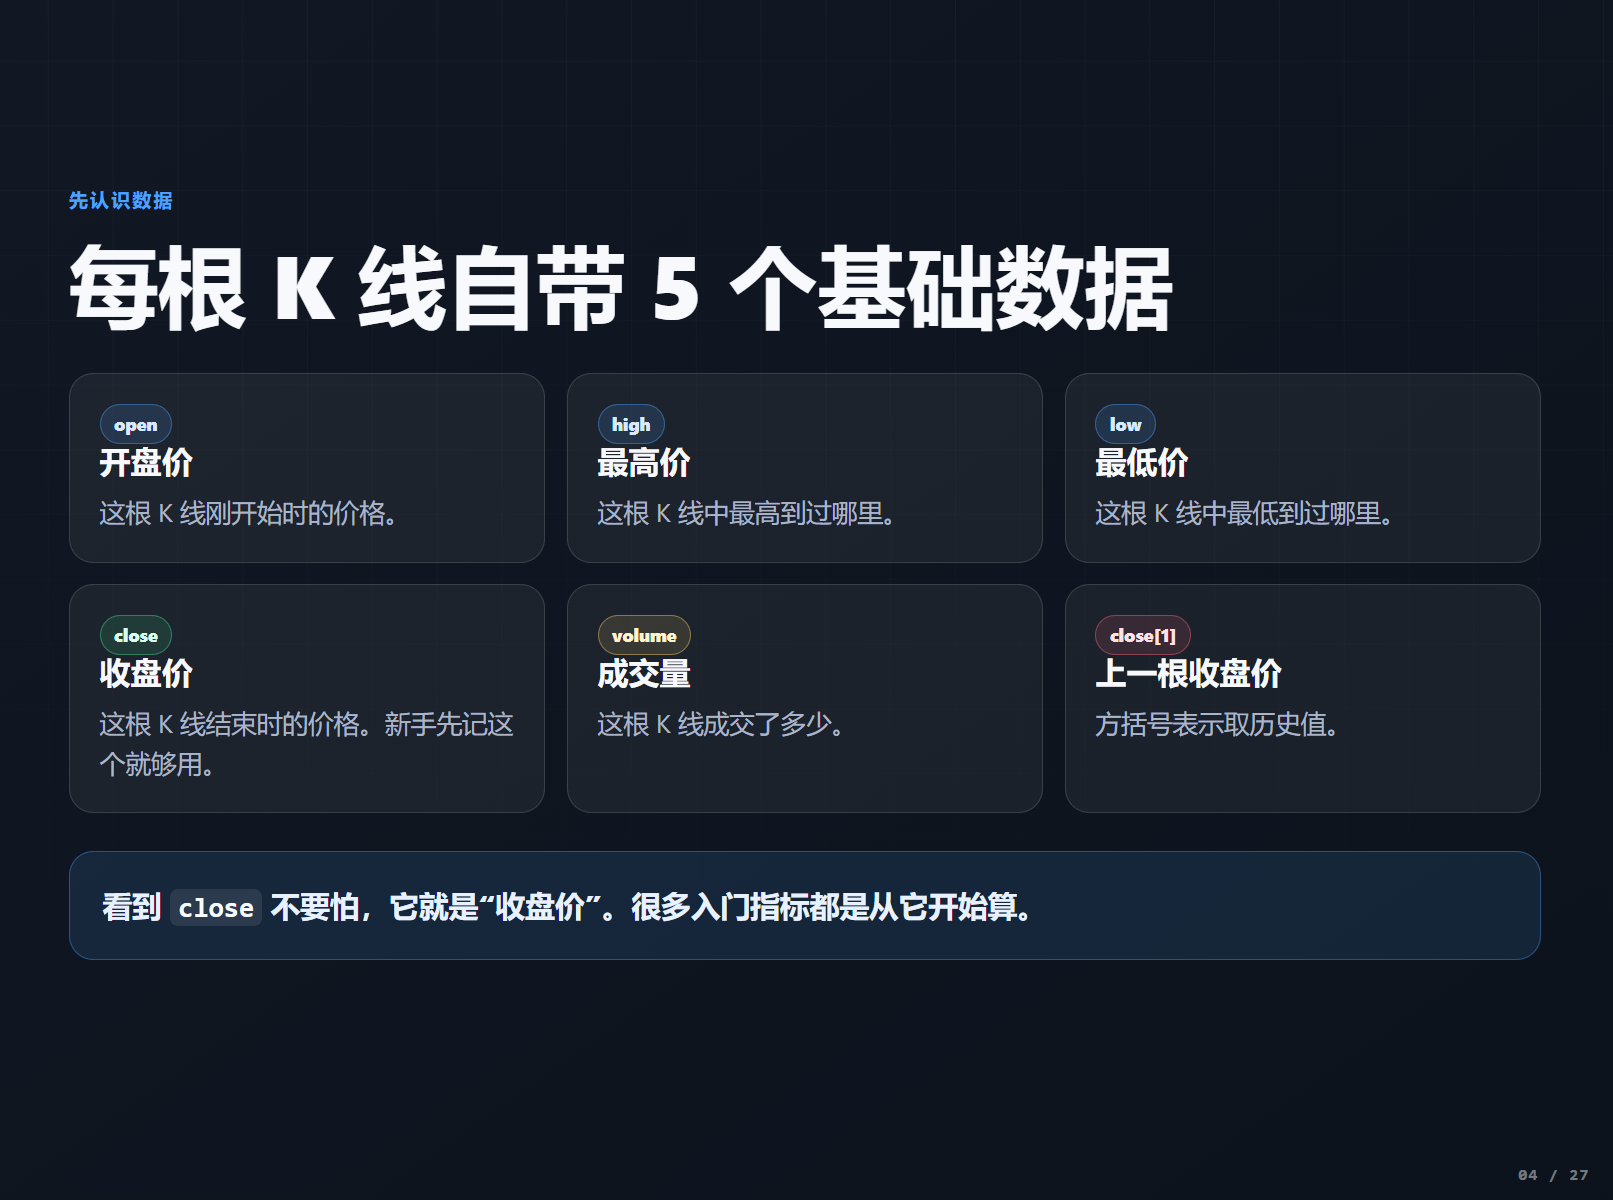
 The system calculates the indicator and essentially processes the data of each candlestick. A candlestick contains 6 core data points; beginners only need to remember the 3 most commonly used:
open: Opening pricehigh: Highest pricelow: Lowest priceclose: Closing price (most important! 90% of entry-level indicators are calculated around the closing price)volume: Transaction volumeclose[1]: Closing price of the previous candlestick, the number in brackets indicates how many candlesticks back to look
We will start with the simplest and most commonly used indicator: "Alert when price crosses above the 20-day moving average", guiding everyone step by step to write the first complete indicator.
First, write the first line of code to calculate the 20-day moving average.
Translated into plain language, it means: Please use the closing prices of the most recent 20 candlesticks to calculate a 20-day moving average, and name this line MA20. Remember a core principle here: The left side is the name, the right side is the algorithm. You can name it anything; calling it a or b does not affect the calculation result, it’s just for your own understanding. This line of code only calculates and does not display on the chart yet.
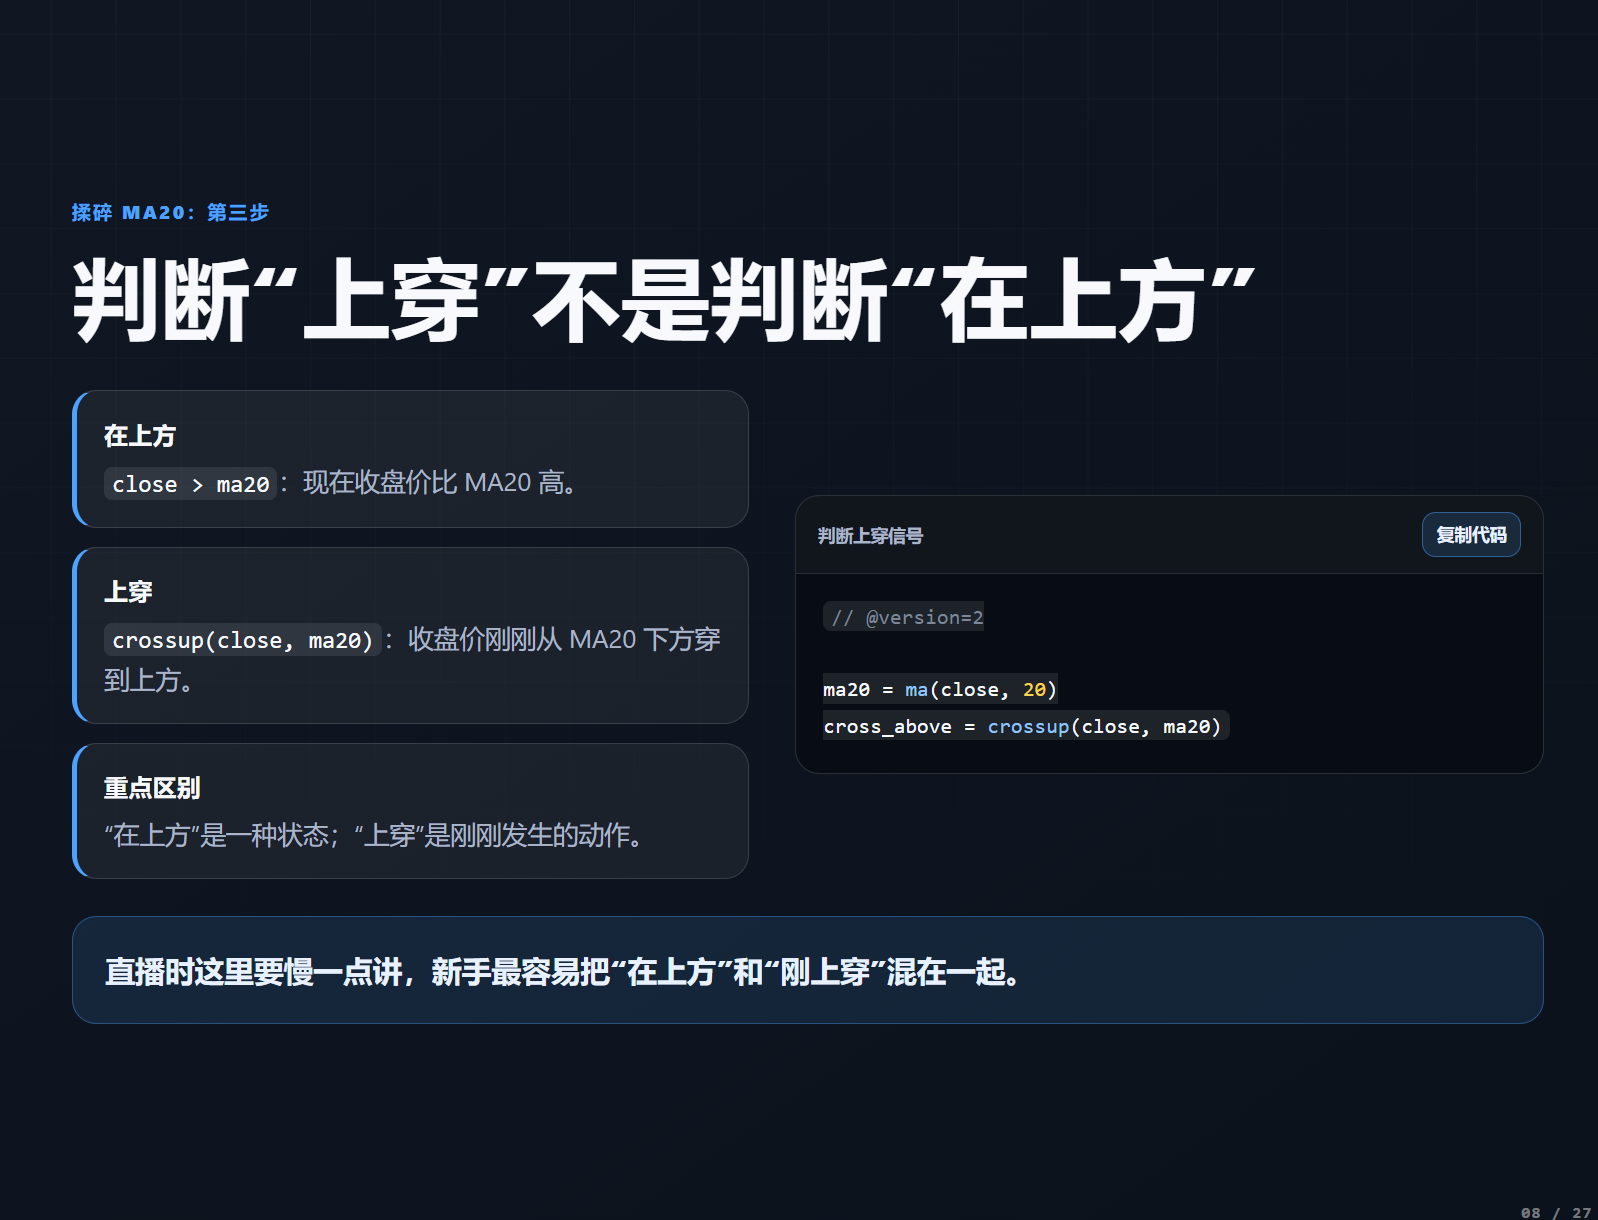
Next, set the signal condition: closing price crosses above the 20-day moving average.
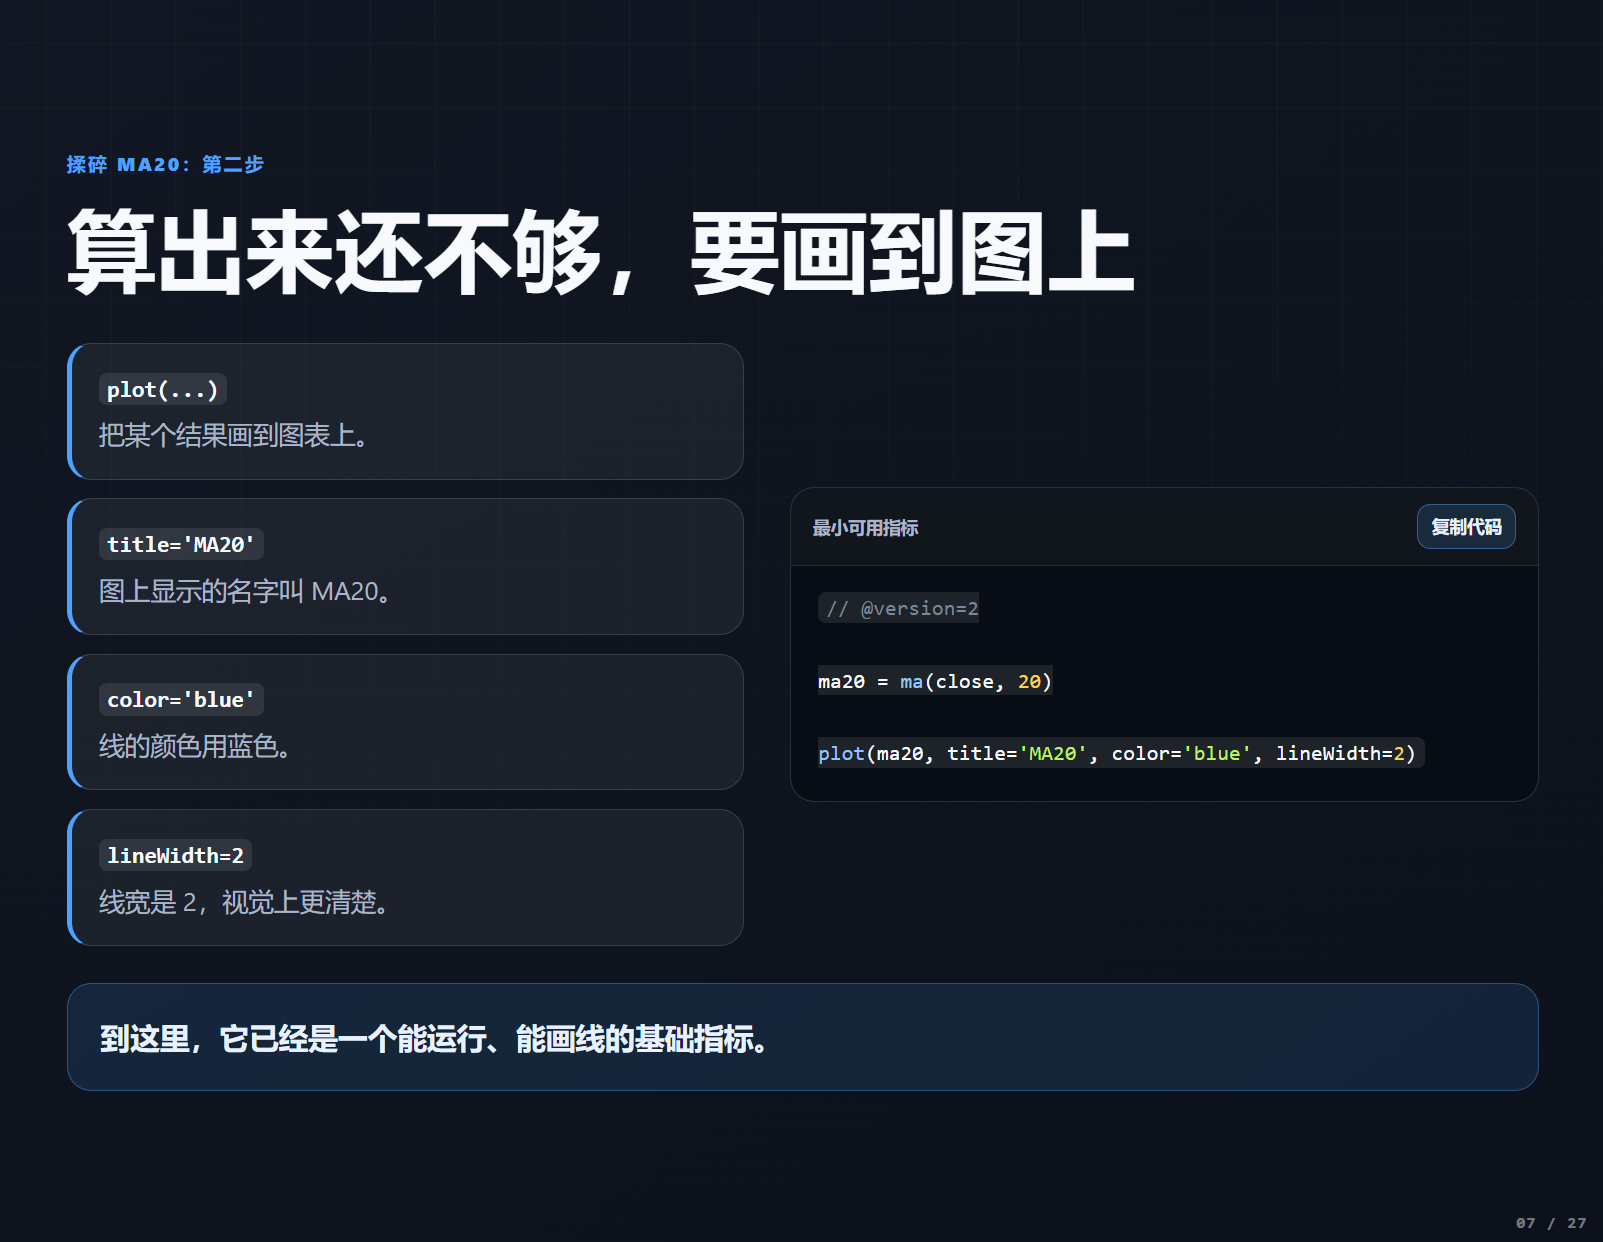
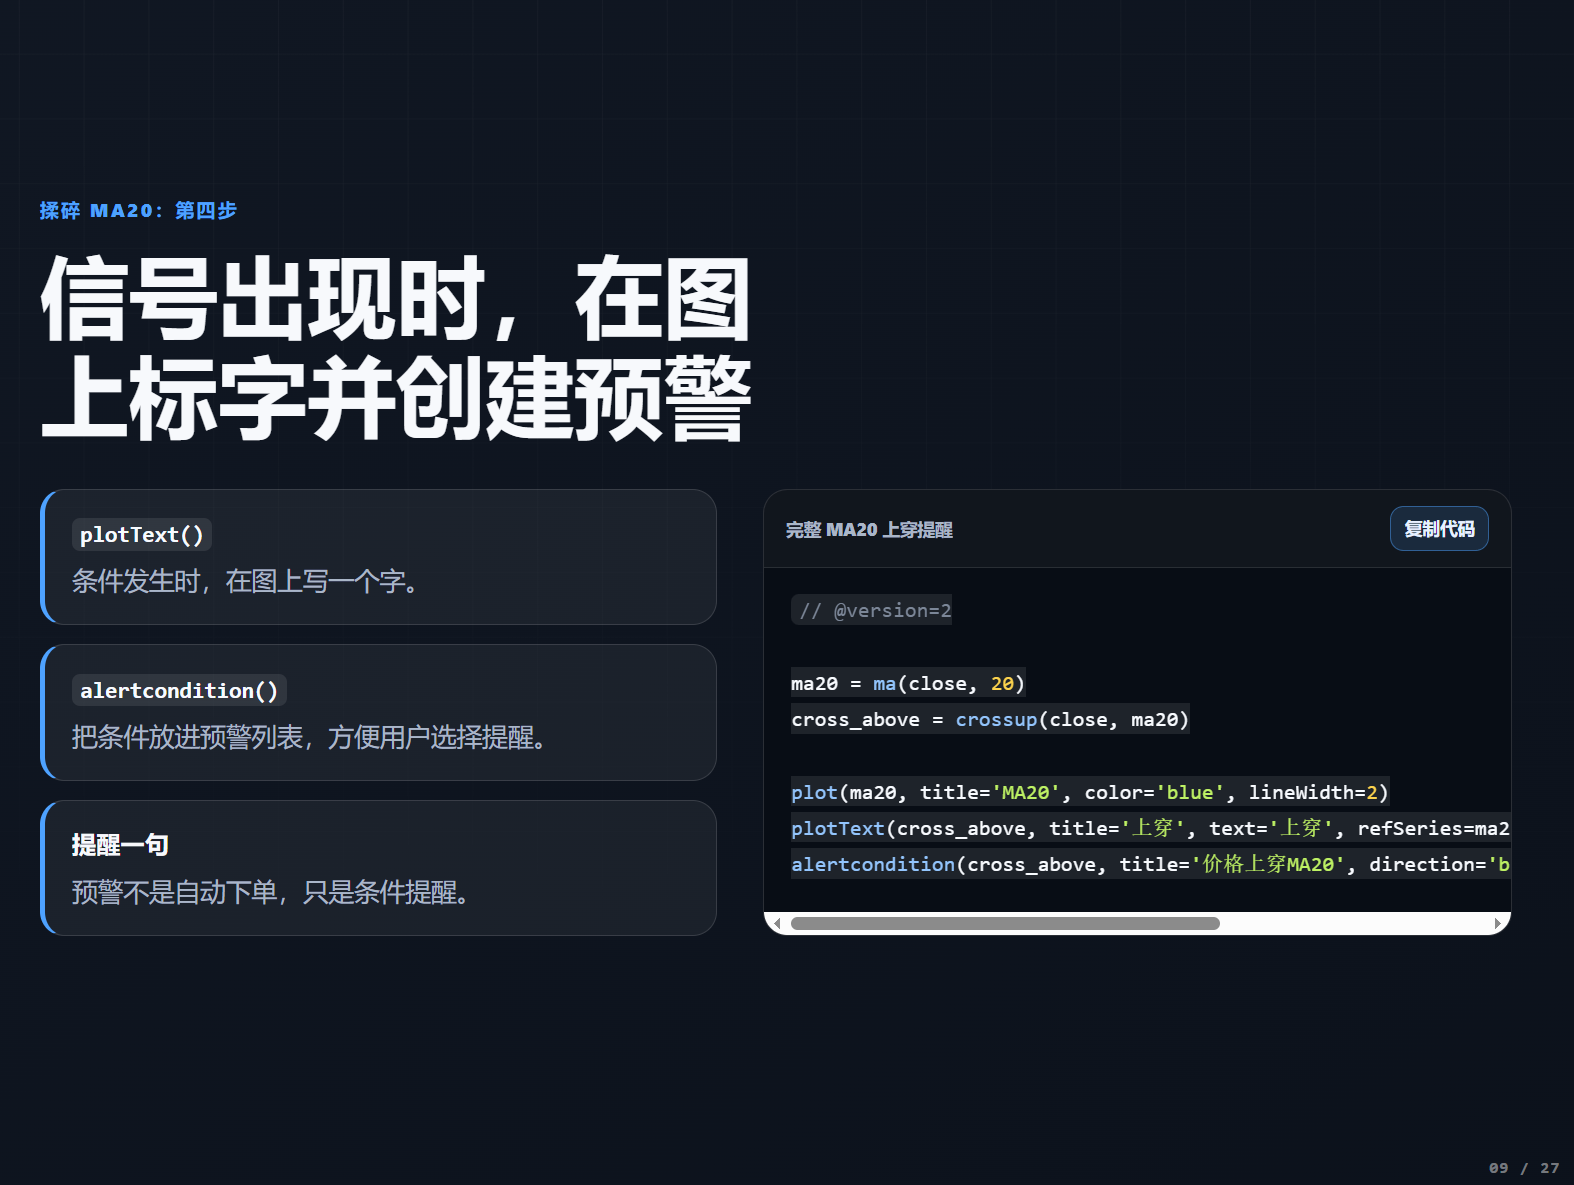
Now we will plot the calculated moving average and signal on the candlestick chart using the plot function.
The first line draws the 20-day moving average, sets the title to "20-day moving average", the color to blue, and the line width to 2, making it clearer on the chart. The second line annotates "Cross Above" near the position where the crossing signal occurs, coloring it green.
Finally, add the alert function, which will automatically send you a pop-up reminder when the conditions are triggered.
It is important to note: Alerts are just condition reminders; they will not automatically place orders, but help you capture signals in time.
Now copy these lines of code into the AiCoin custom indicator editor, click save, and you have created your first written indicator! Once the alert is activated, you will receive a reminder whenever the price crosses above the 20-day moving average. 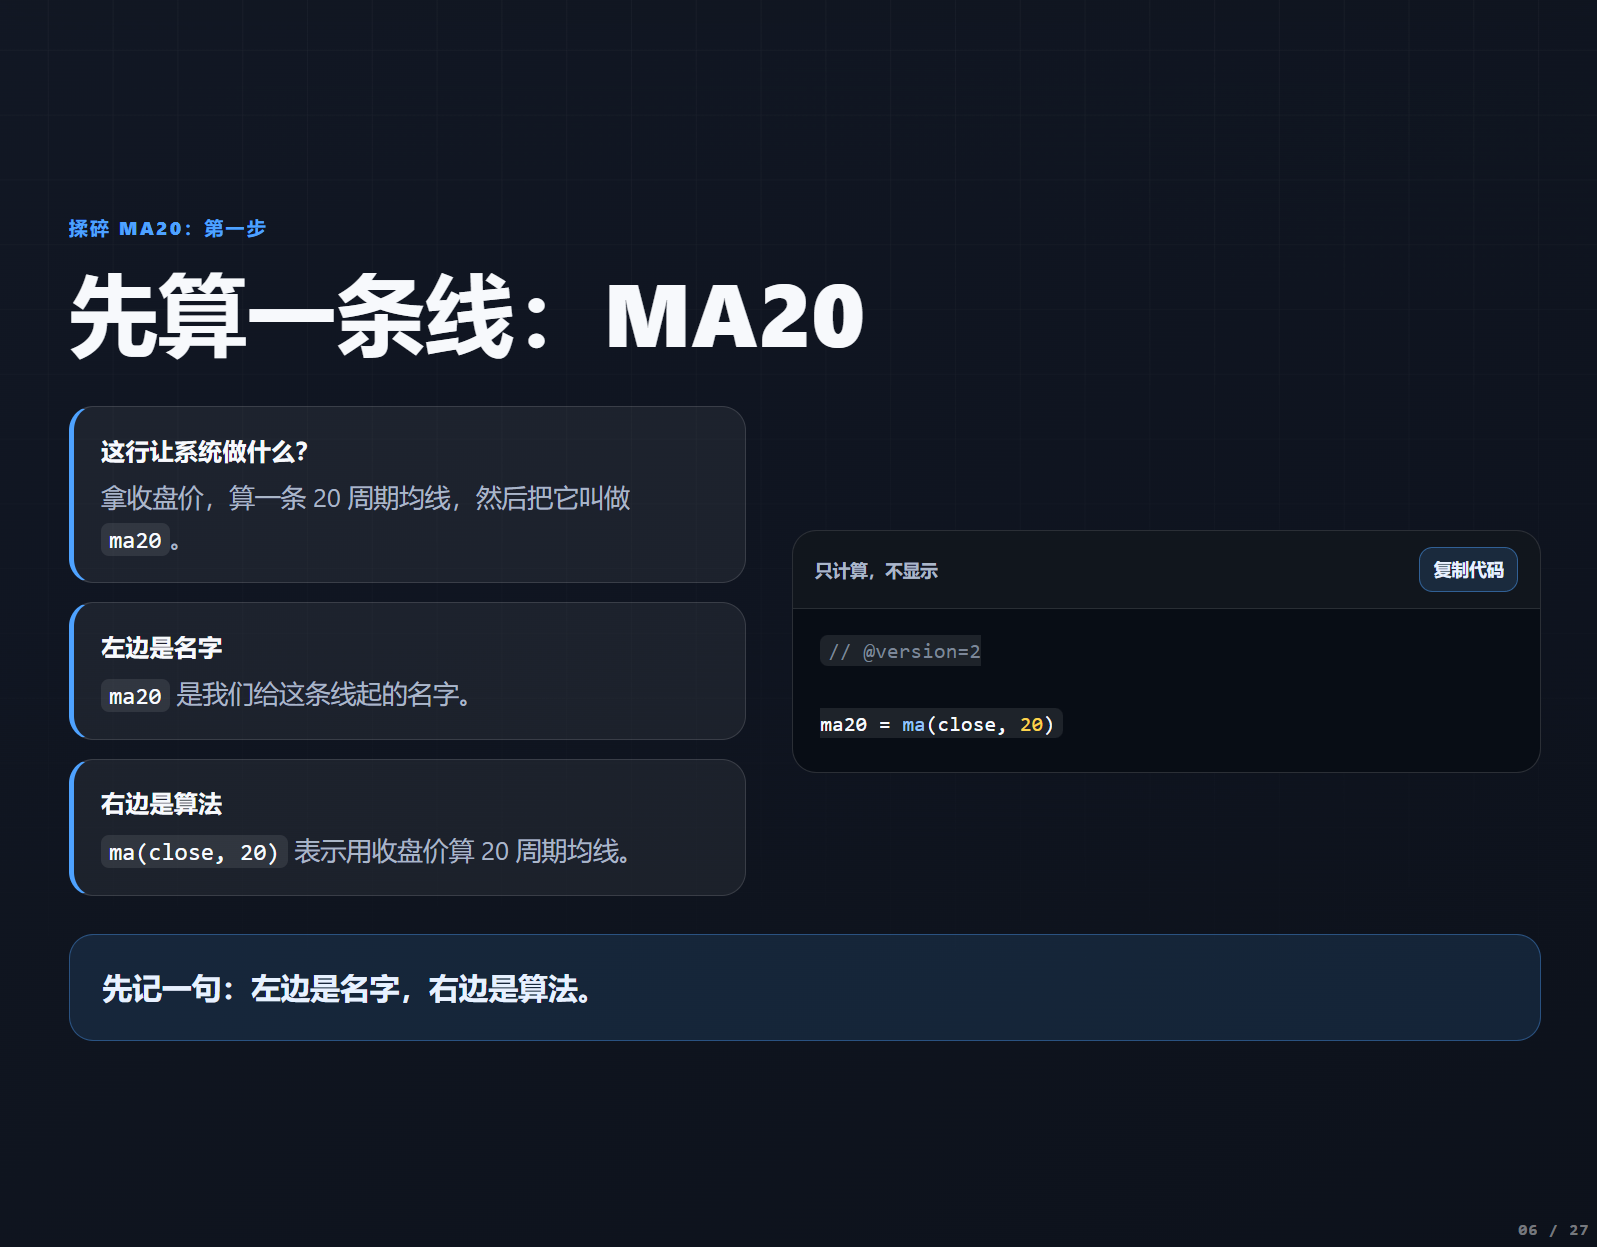
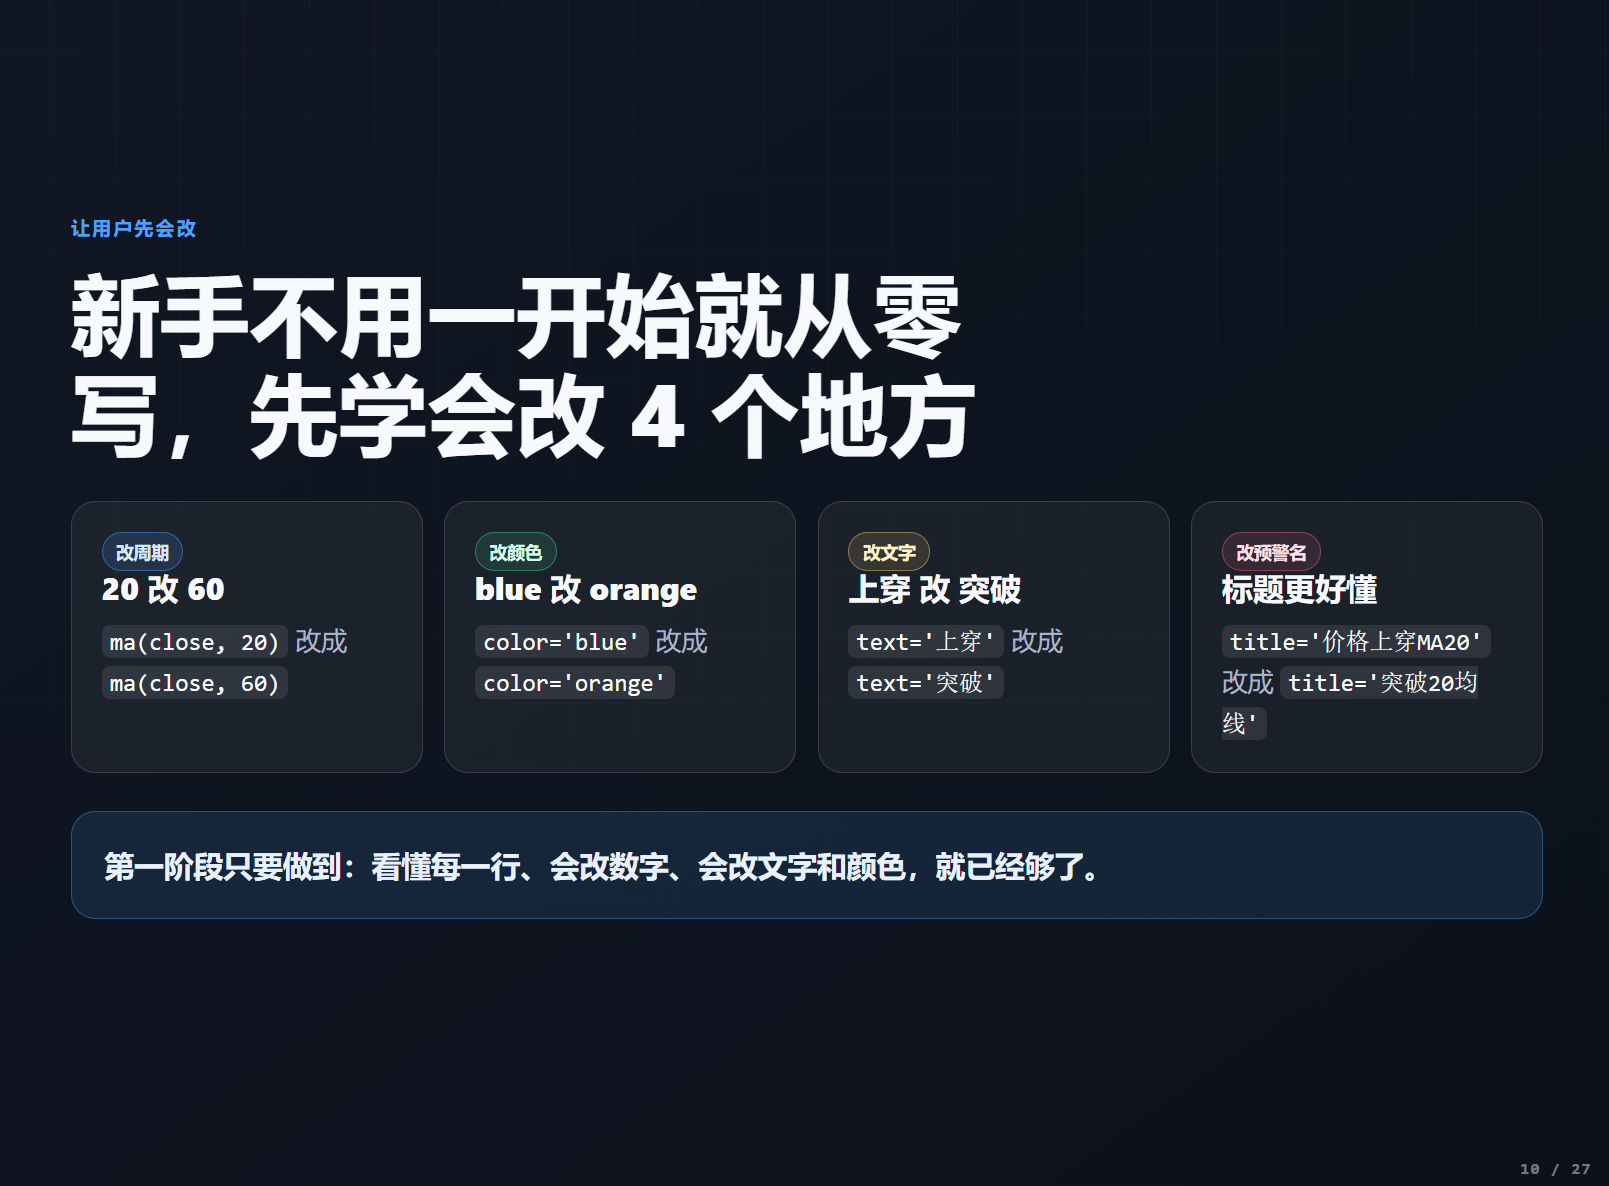
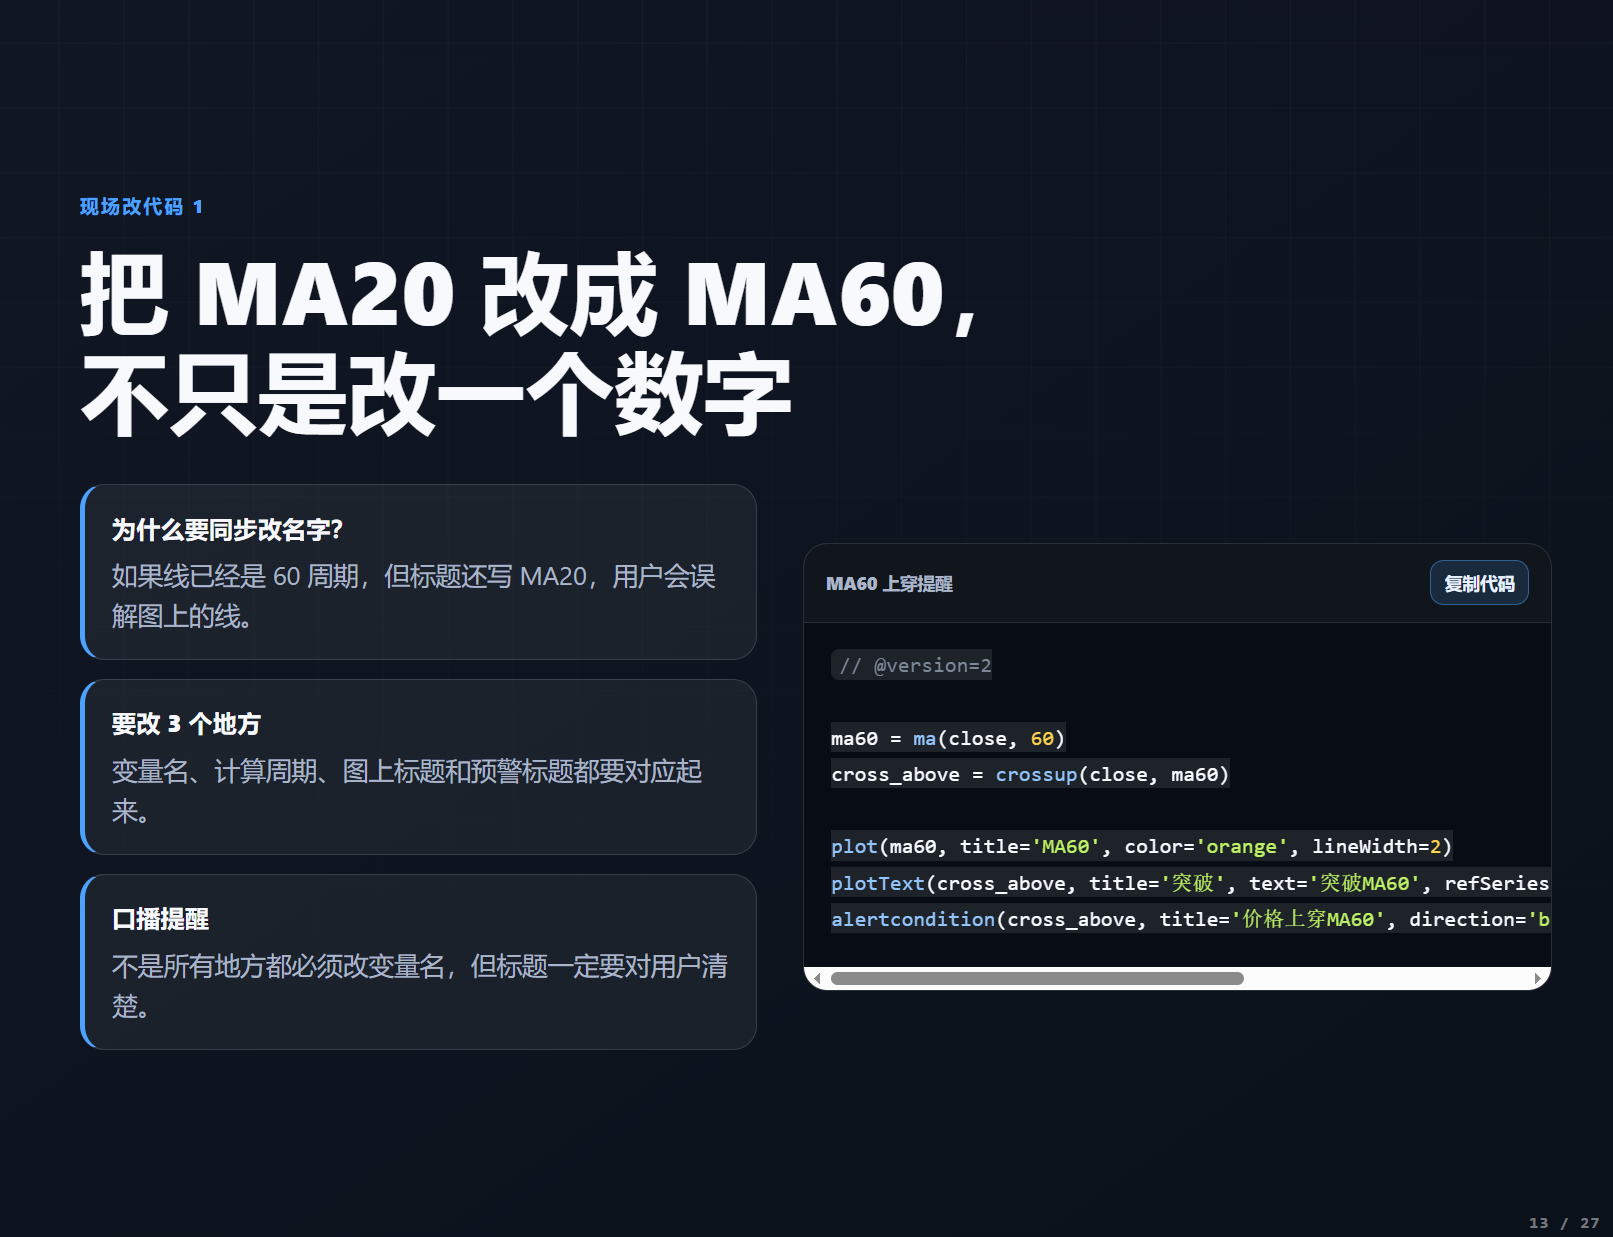 You don’t have to start from scratch; modify existing indicators, and you can create a version that suits you best. This is the fastest way for beginners to get started.
 Let’s increase the difficulty and write a moving average that automatically changes color based on price position: it shows green when the price is above the moving average and red when it is below.
This will utilize a very practical ternary operator, formatted as: condition ? resultA : resultB, which means that if the condition holds true, use A; if not, use B.
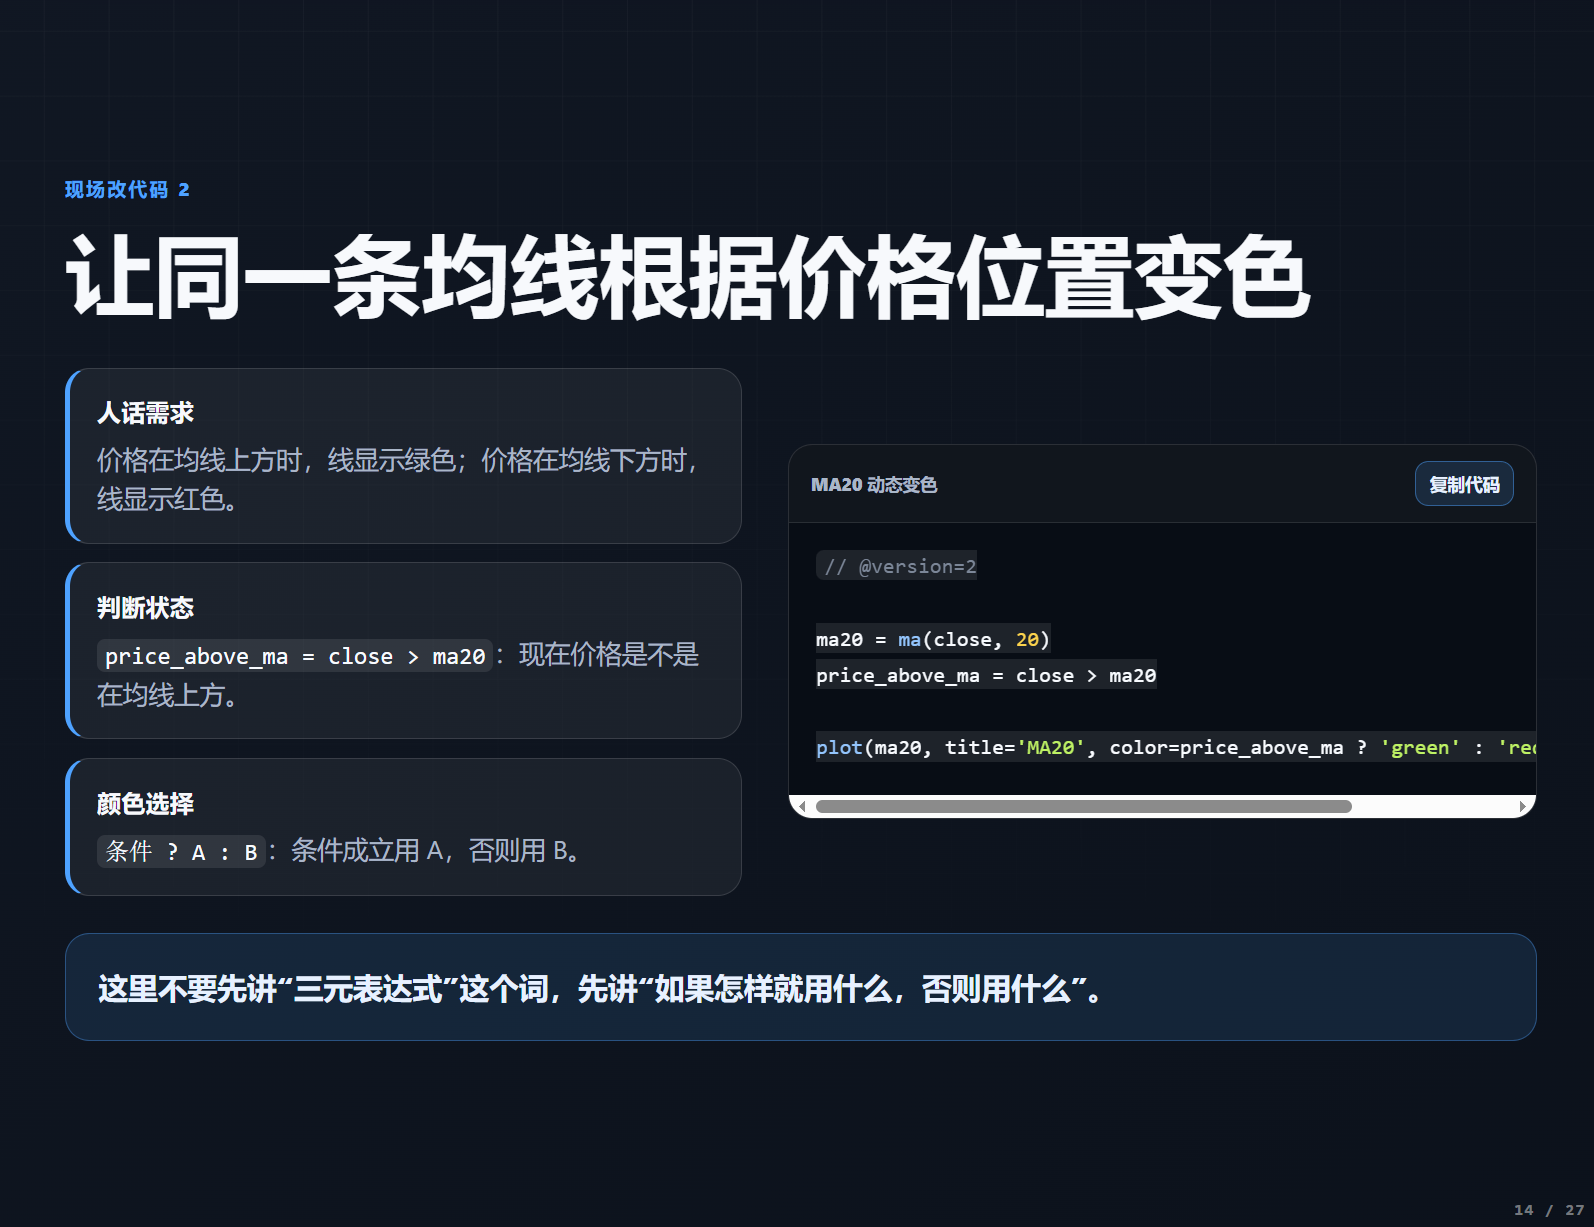 After saving, you will see that the moving average will automatically switch colors following the price movements, making trends clear.
Once you master the four-step framework, other indicators are merely variations of the same theme. Let’s quickly go through several of the most commonly used ones.
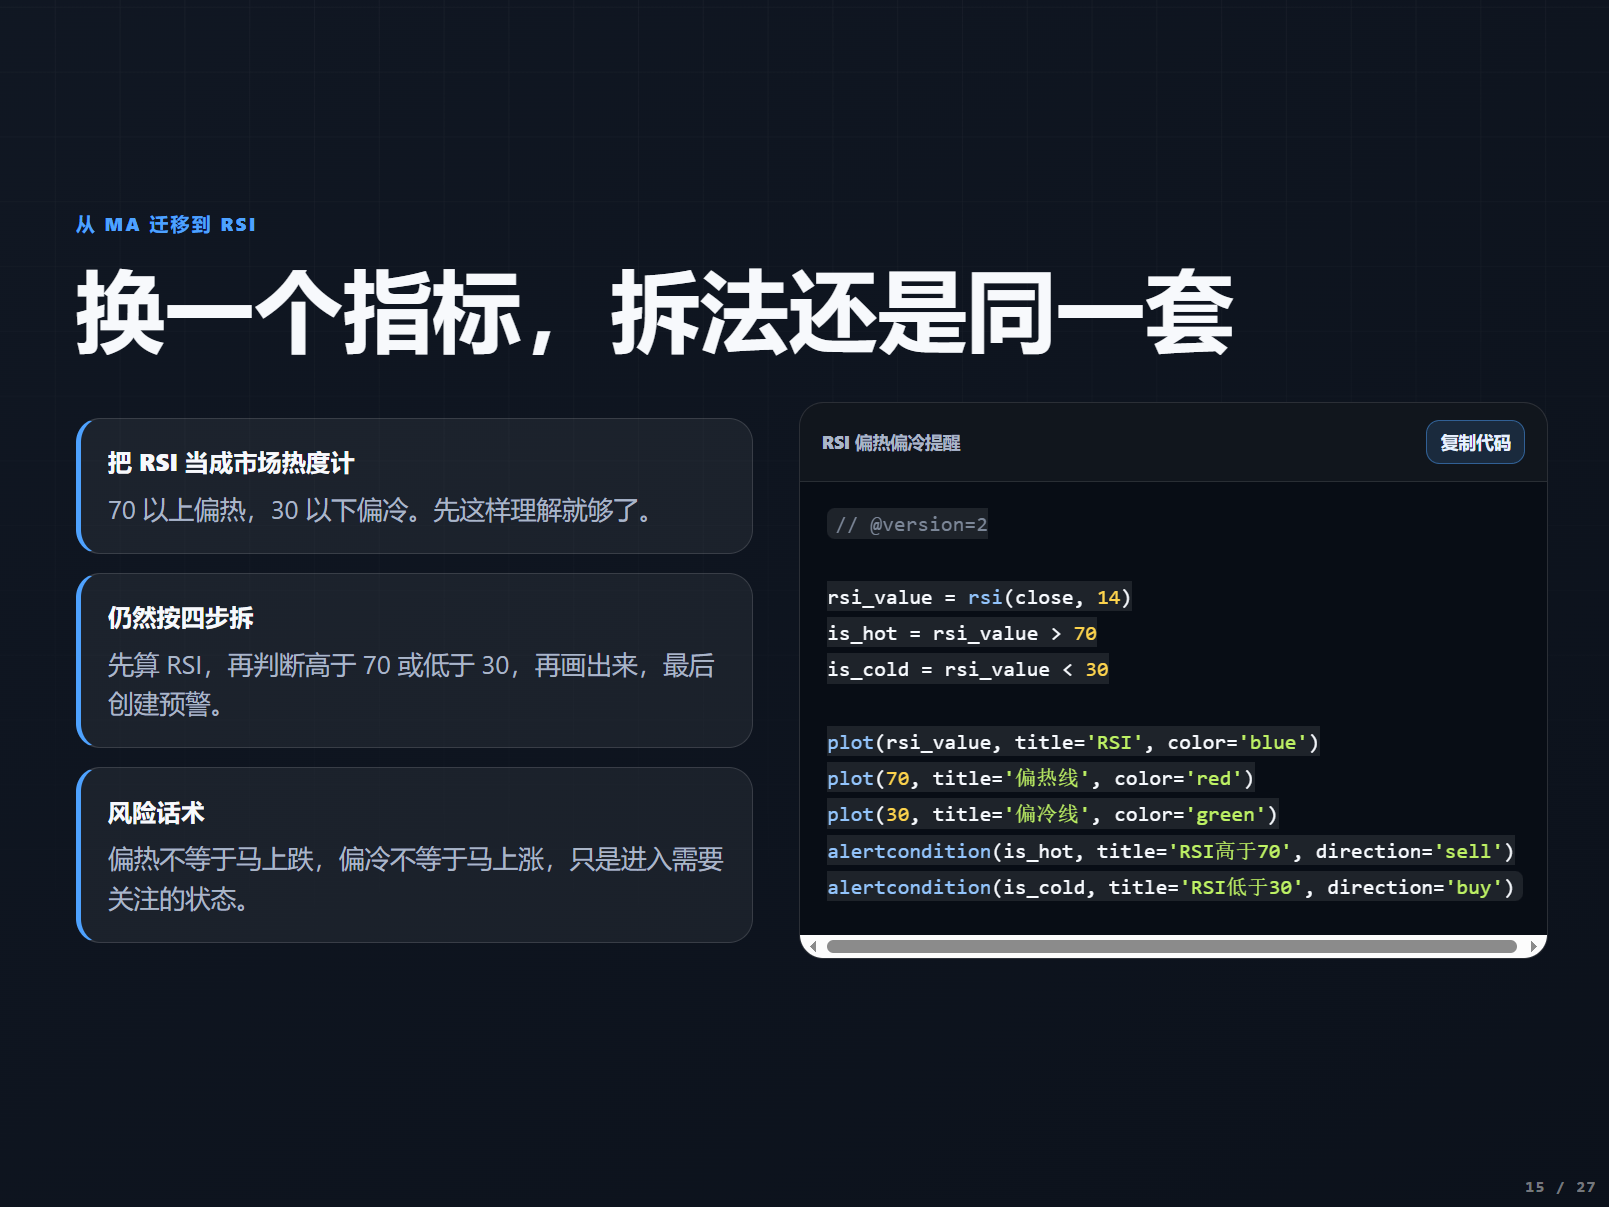
RSI is like a thermometer for market heat, with above 70 indicating overbought conditions and below 30 indicating oversold conditions.
The RSI indicator is generally displayed in a sub-chart, allowing you to directly see the temperature of the market.
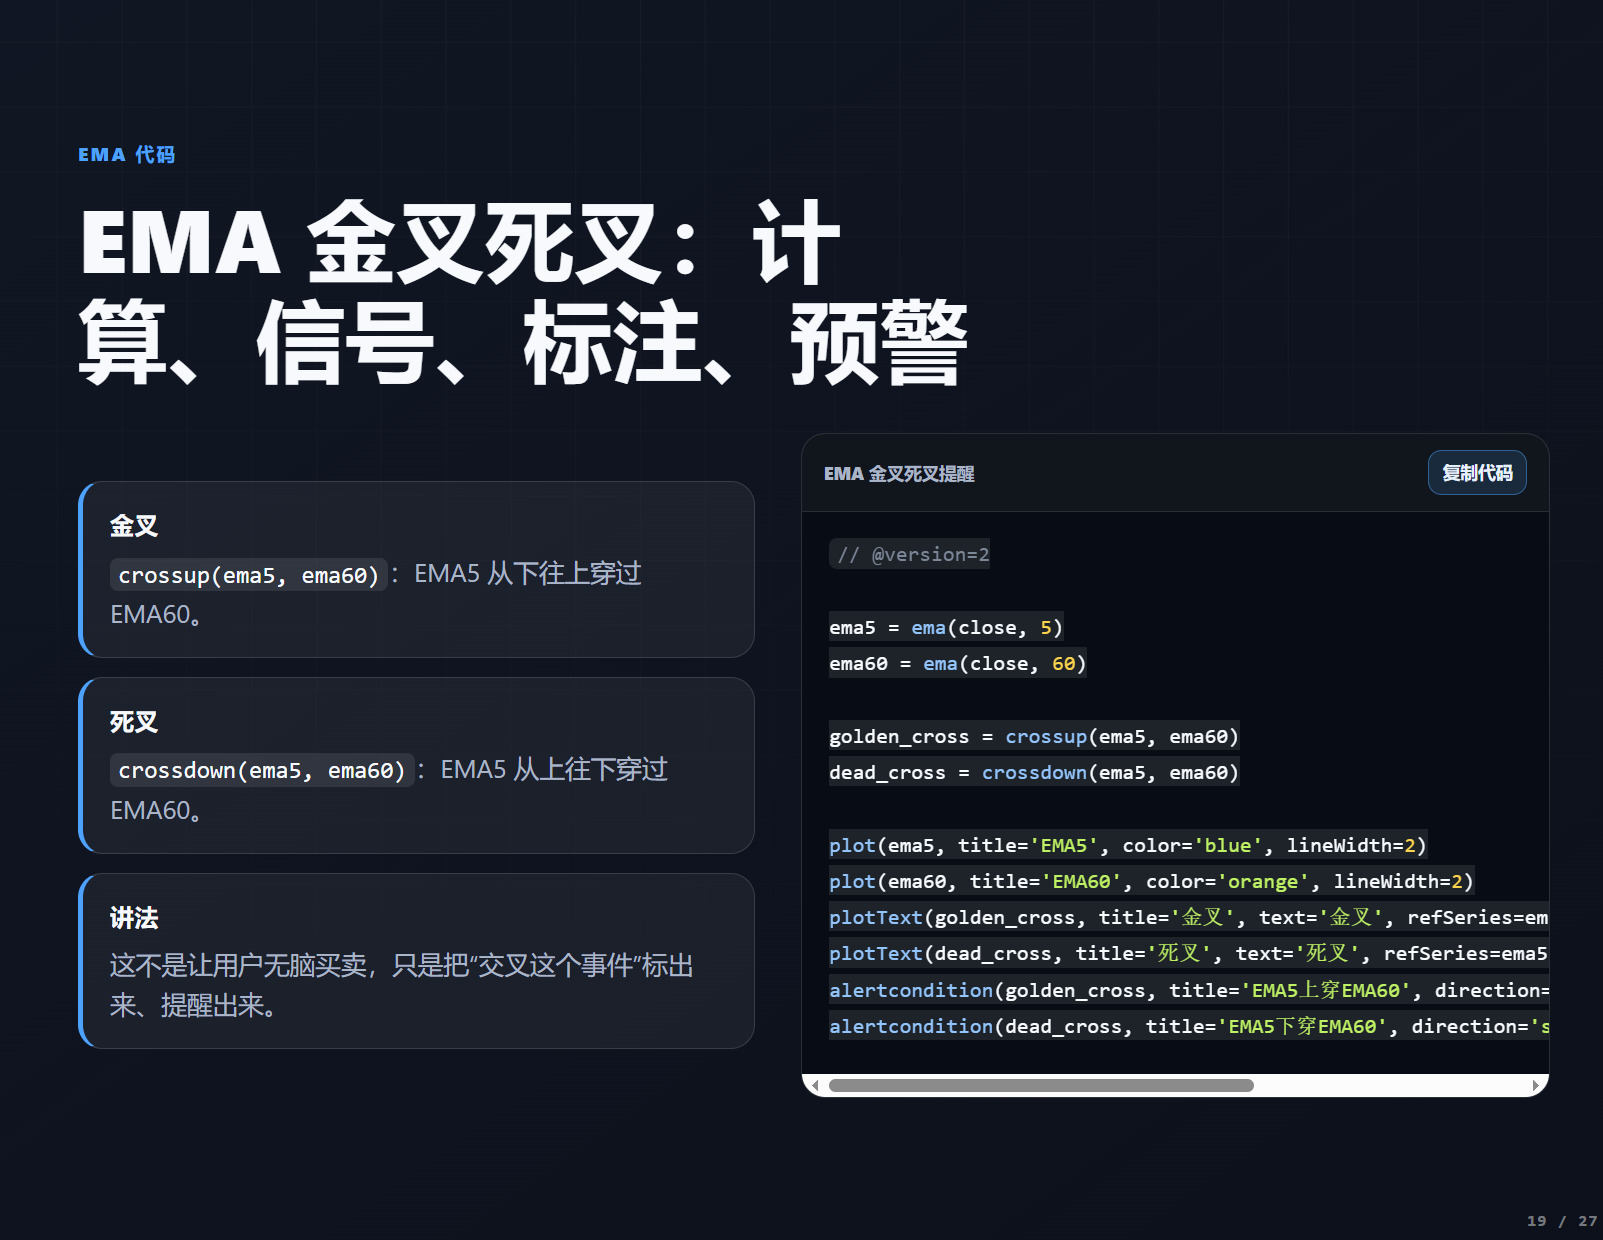
 EMA is the Exponential Moving Average, which reacts faster than a regular MA and is commonly used in a combination of 5 days and 60 days to judge trends.
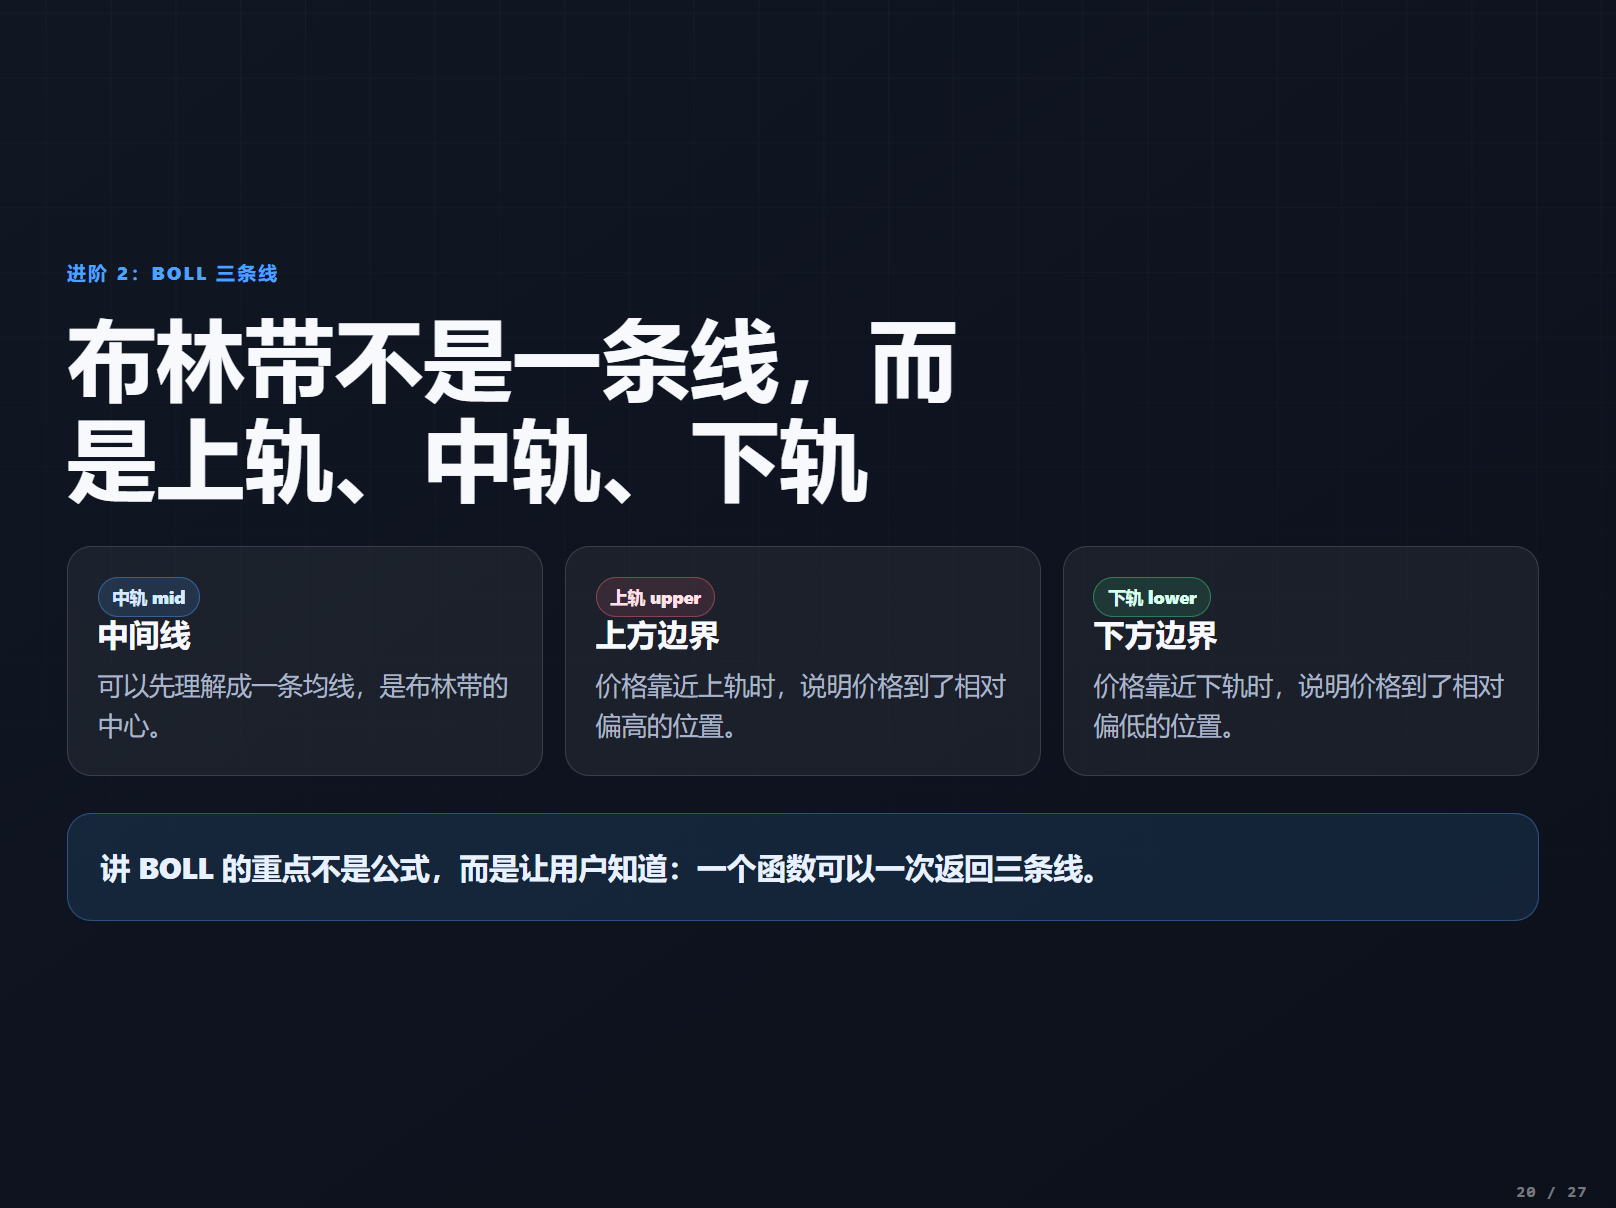
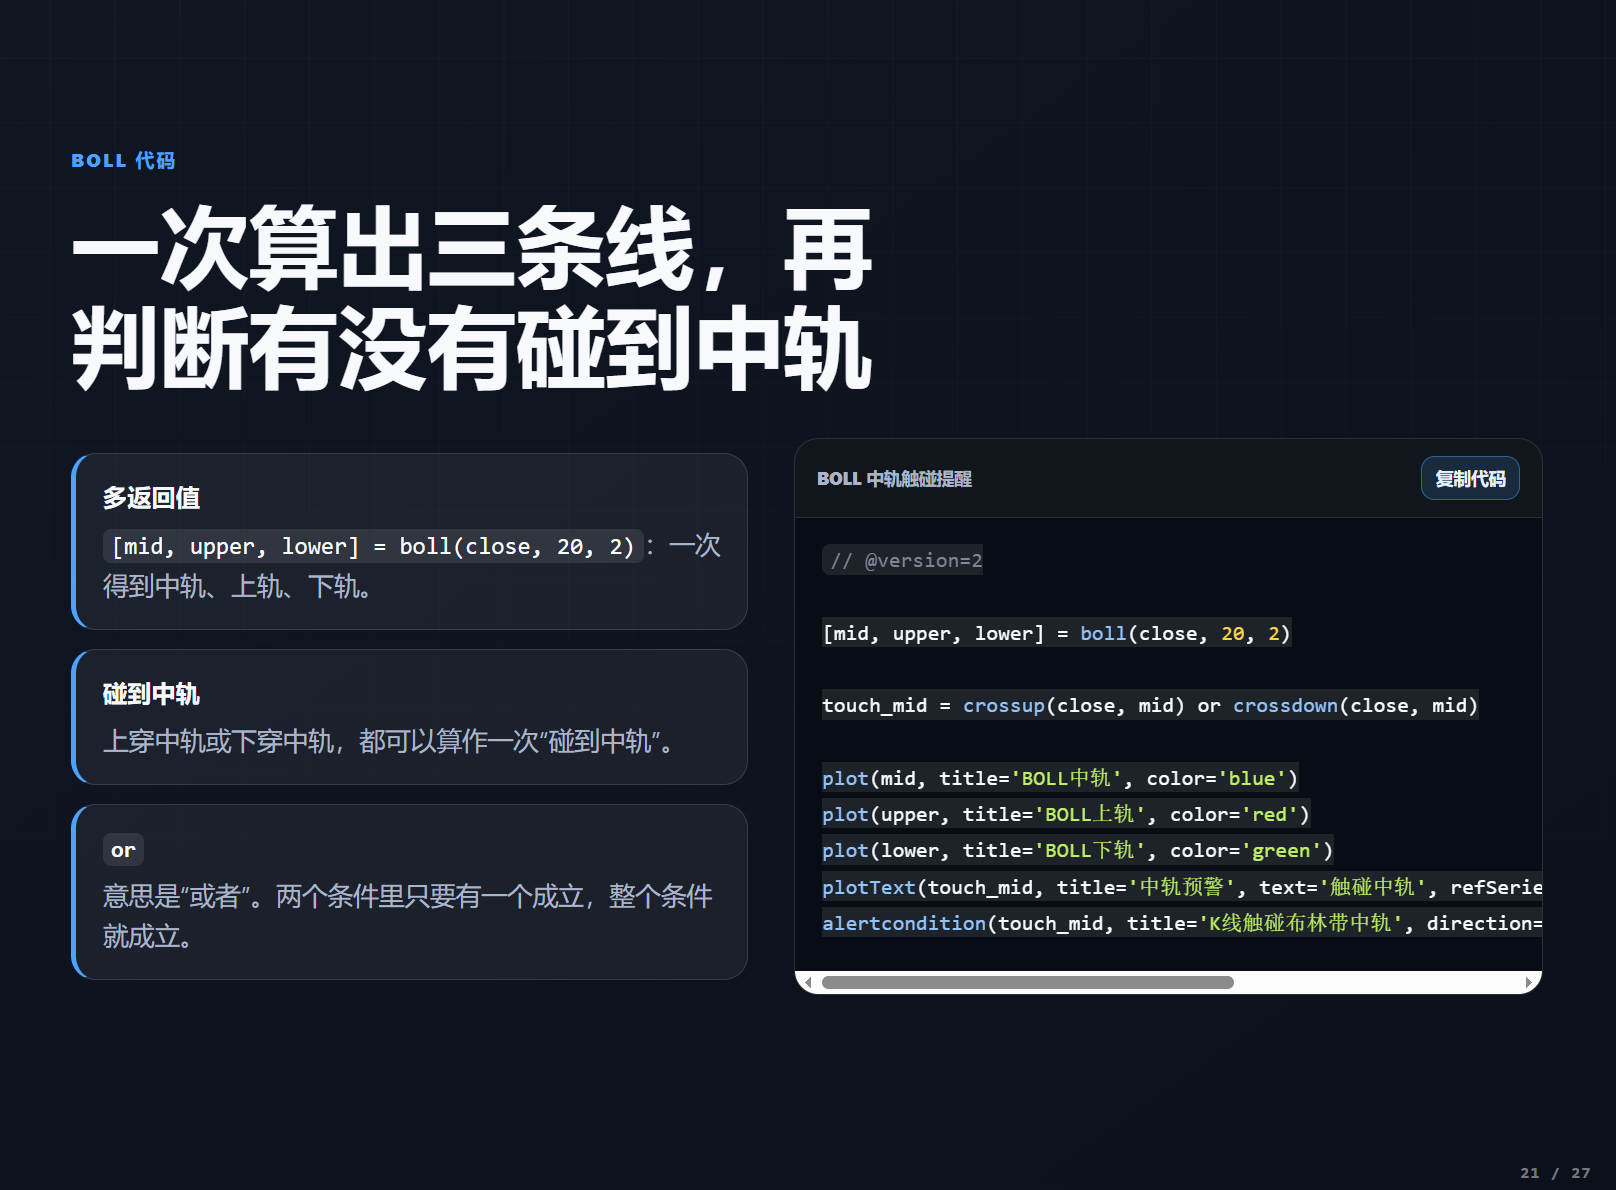
 Bollinger Bands consist of three lines: the middle line, upper line, and lower line. A price near the upper line indicates overbought conditions, while near the lower line indicates oversold conditions.
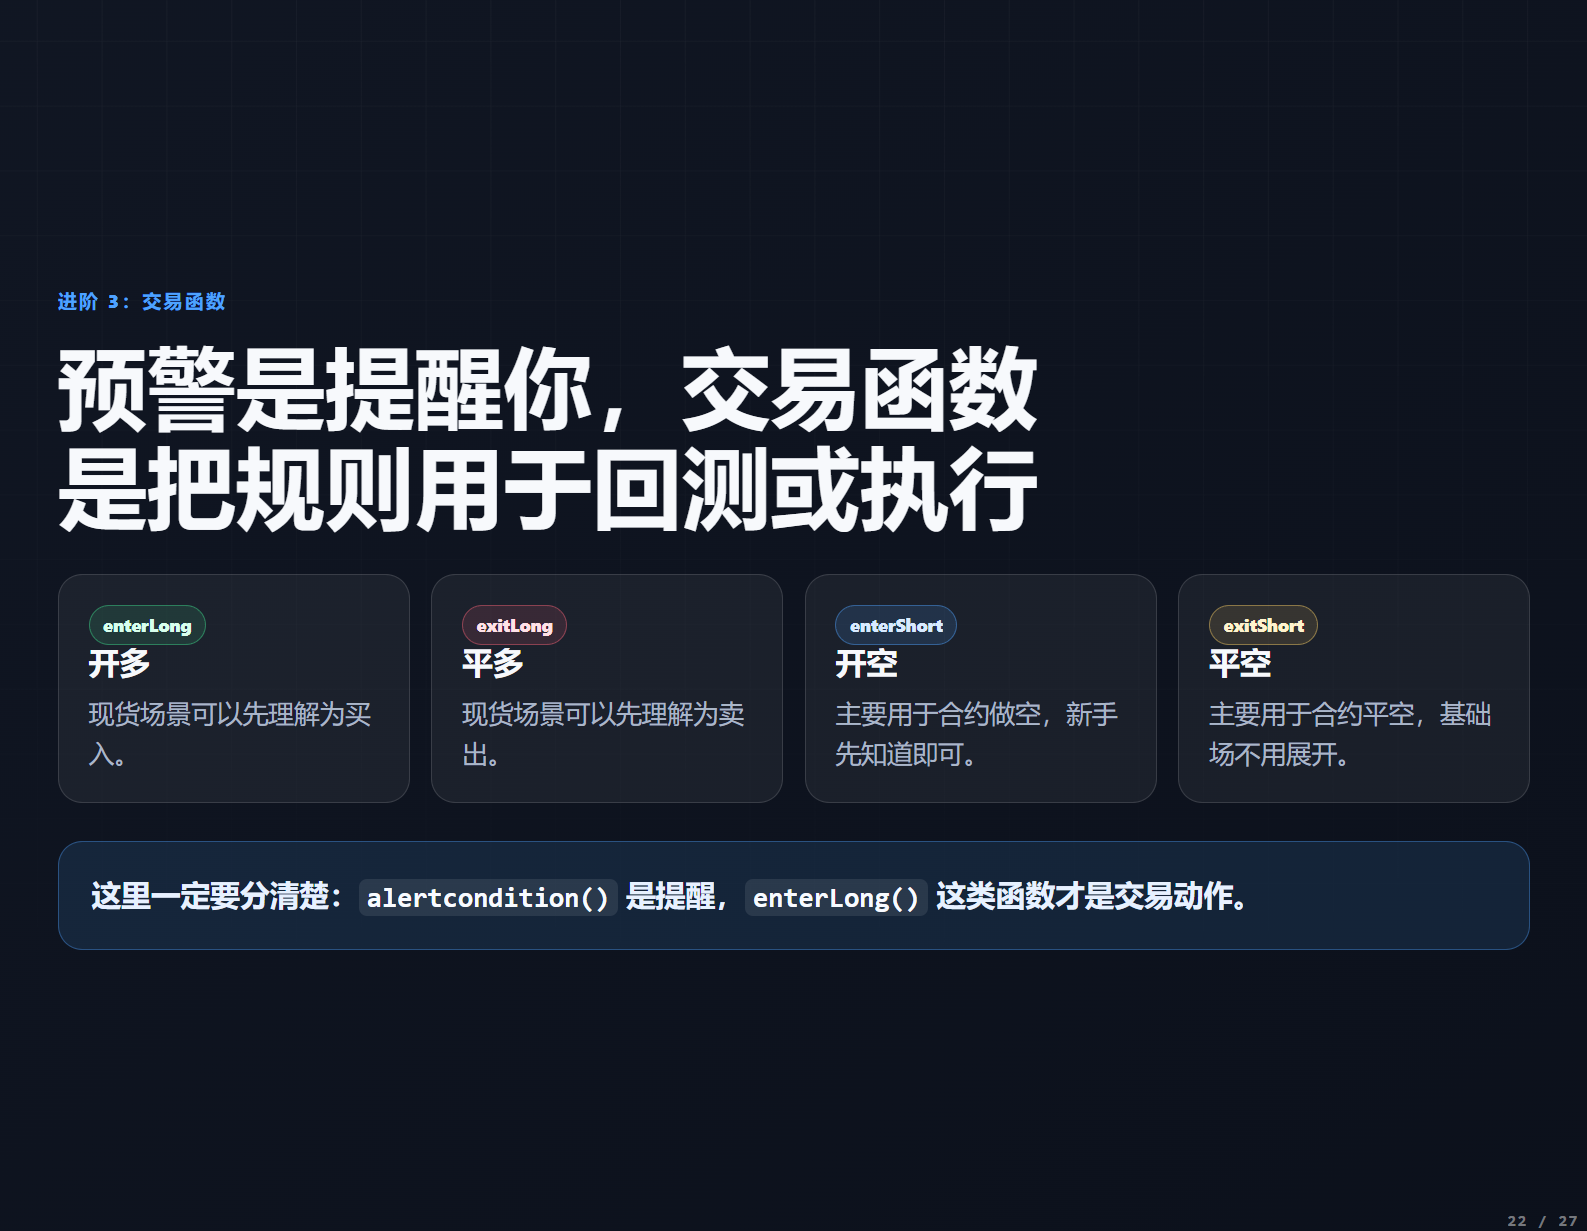
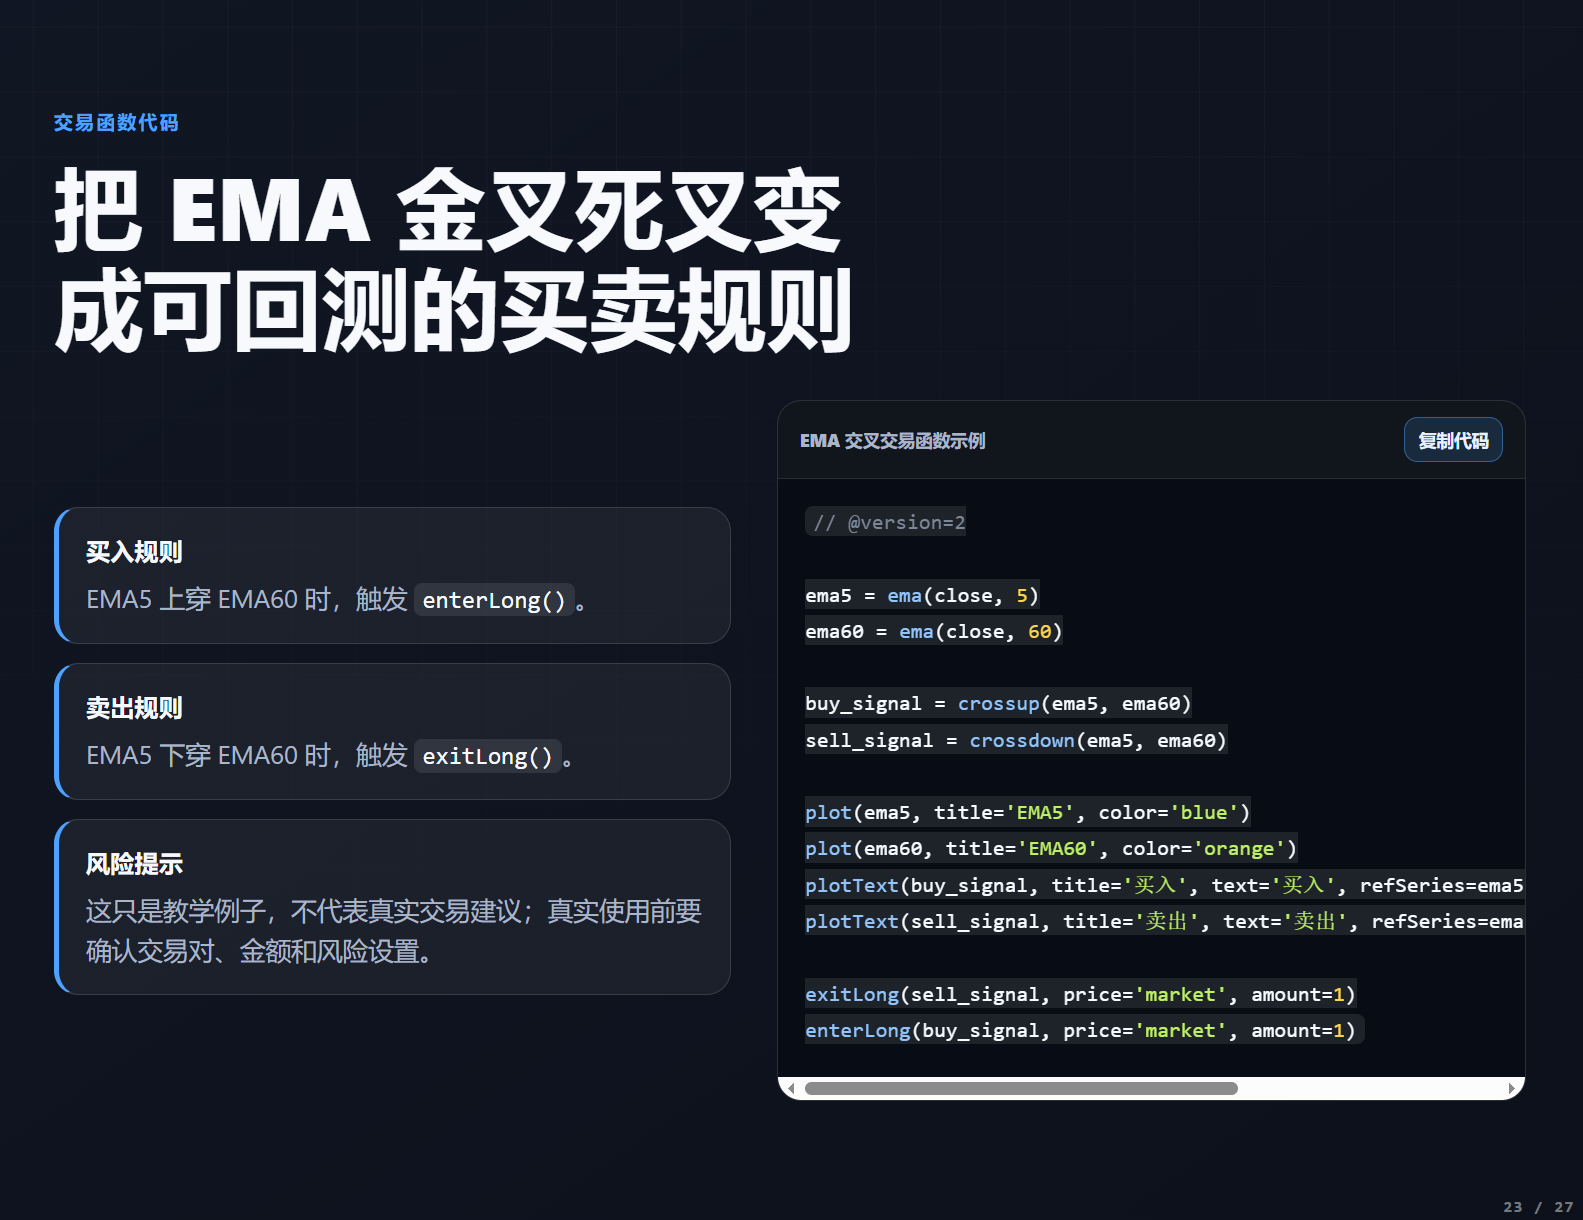
 Alerts are just reminders; trading functions can truly implement automated trading. We will modify the previous EMA golden cross and dead cross into an automated trading strategy:
 Absolutely do not trade directly after writing! You must first use the backtesting feature to verify the historical performance of the strategy. In AiCoin, click the "Backtest" button, select the backtest period and parameters, and the system will automatically calculate the strategy's win rate, return rate, maximum drawdown, and other key data. If the backtesting results are poor, it means your trading logic needs optimization, which can help you avoid many real trading losses.
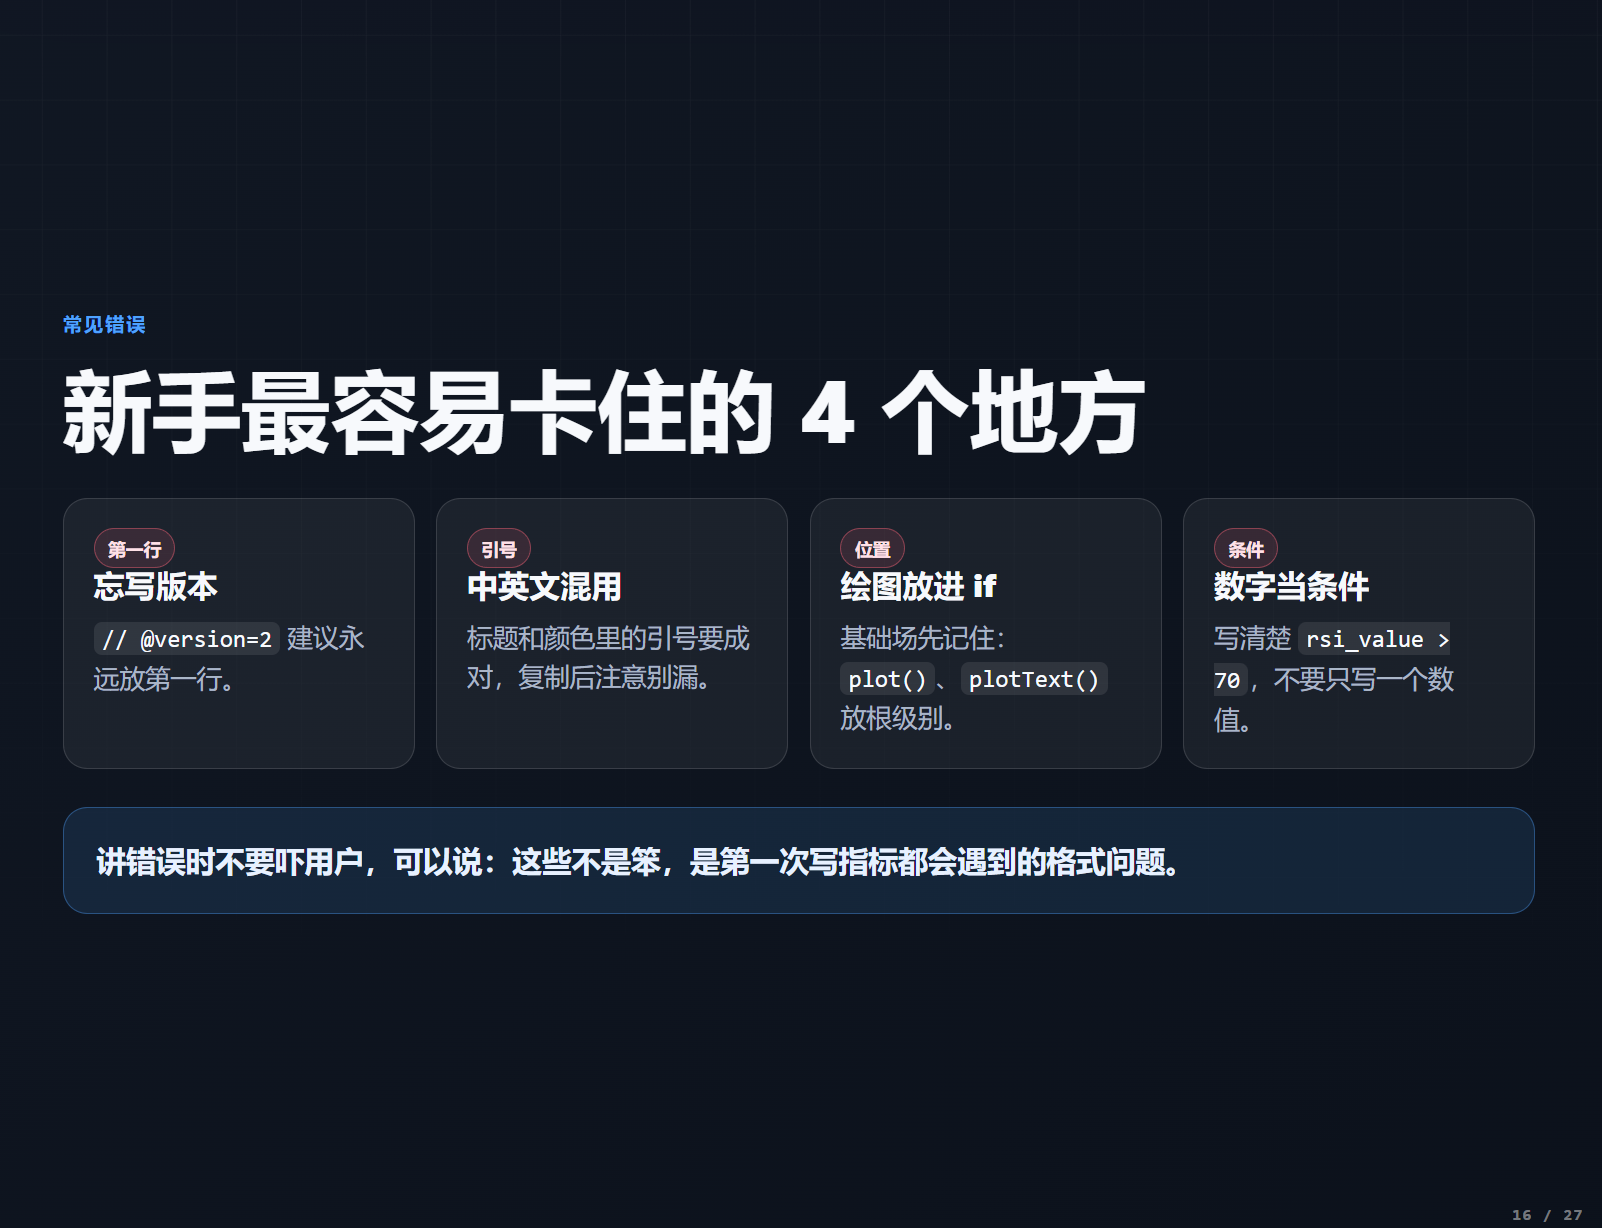
The 4 Mistakes Beginners Are Most Likely to Make
- Forgetting to write the version number: The first line of all indicators must be
version=2, which tells the system to use our second version syntax. The editor now defaults to adding this, so there is no need to write it manually. - Mixing Chinese and English punctuation: The quotation marks, brackets, and commas in the code must be input using the English input method; Chinese punctuation cannot be recognized by the system. This is the most common mistake for beginners.
- Incomplete condition writing: Do not just write a number as a condition, for example, you cannot just write
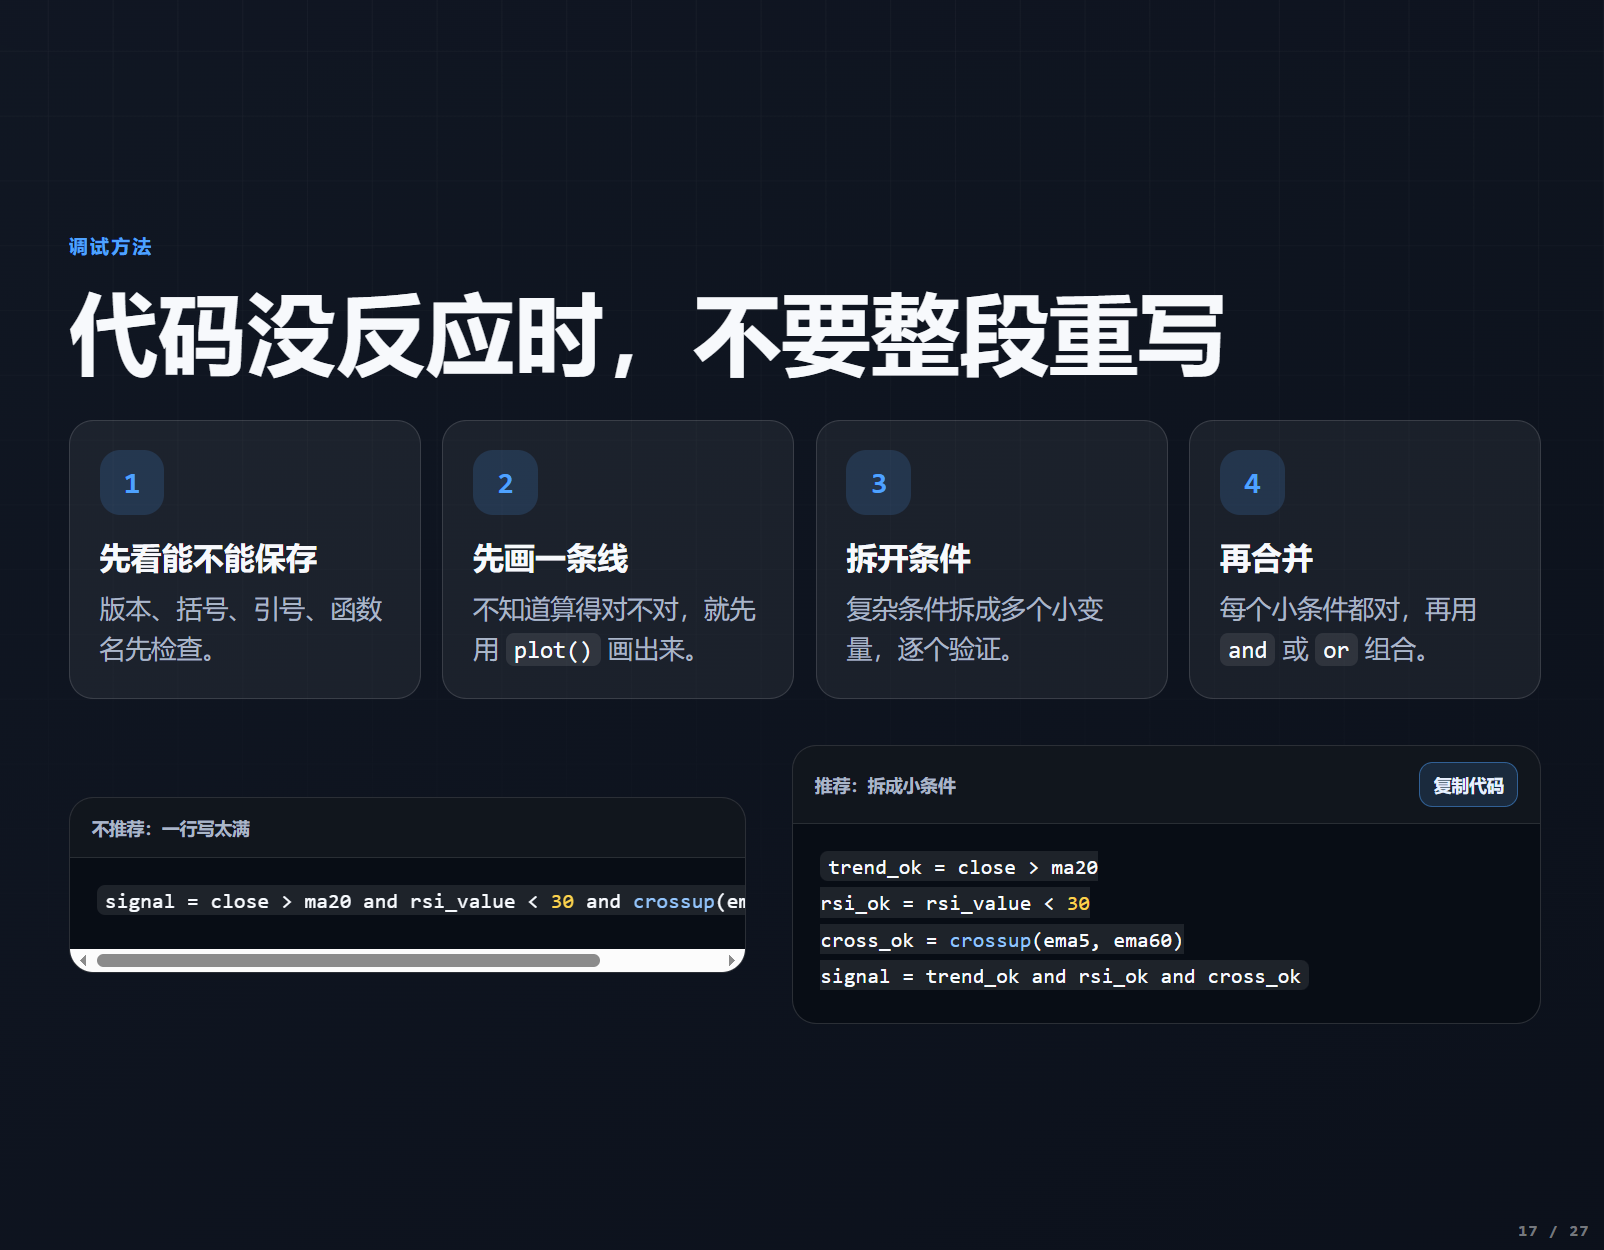
70, you should write it in full asRSI14 > 70. - Writing too long of a code line: Break complex conditions into multiple smaller variables and validate them one by one. This makes it easier to troubleshoot errors and convenient for future modifications.
Final Summary
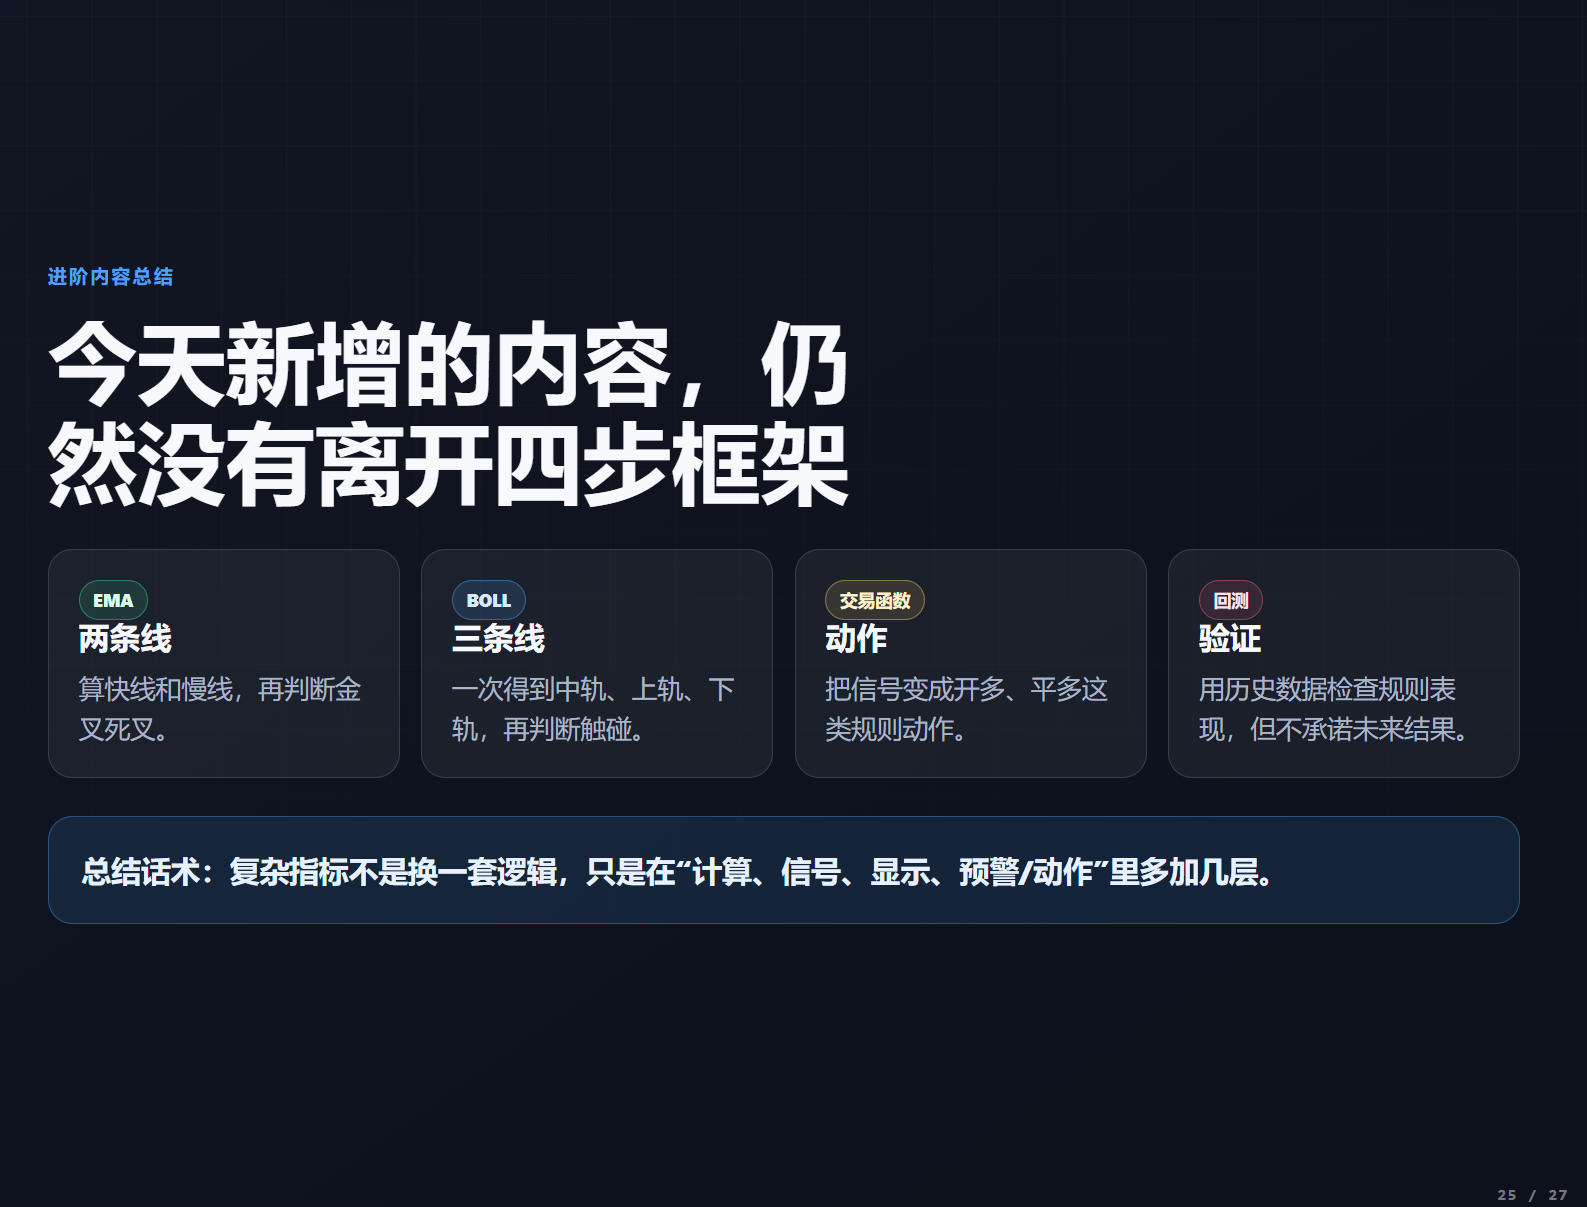 Today, we used a four-step framework, starting from the simplest 20-day moving average to strategies that can potentially trade automatically. The core is: first calculate the values, then set the conditions, then plot the results, and finally add alerts. Complex indicators are just a few layers of additional calculations and judgments based on this foundation.
If you cannot write it yourself, that’s okay. When customizing indicators with customer service, just clearly state 5 questions: what data to use, what indicator to calculate, what conditions trigger signals, what to display on the chart, and whether to have alerts. Technicians can help you achieve this. If you encounter code you don’t understand, you can also send it to AI for a line-by-line explanation.
This article only represents the author's personal opinion and does not reflect the platform's stance or views. This article is for information sharing only and does not constitute any investment advice to anyone.
免责声明:本文章仅代表作者个人观点,不代表本平台的立场和观点。本文章仅供信息分享,不构成对任何人的任何投资建议。用户与作者之间的任何争议,与本平台无关。如网页中刊载的文章或图片涉及侵权,请提供相关的权利证明和身份证明发送邮件到support@aicoin.com,本平台相关工作人员将会进行核查。