Coin Ocean Waves: 5.29 Bitcoin (BTC) Market Analysis Reference:
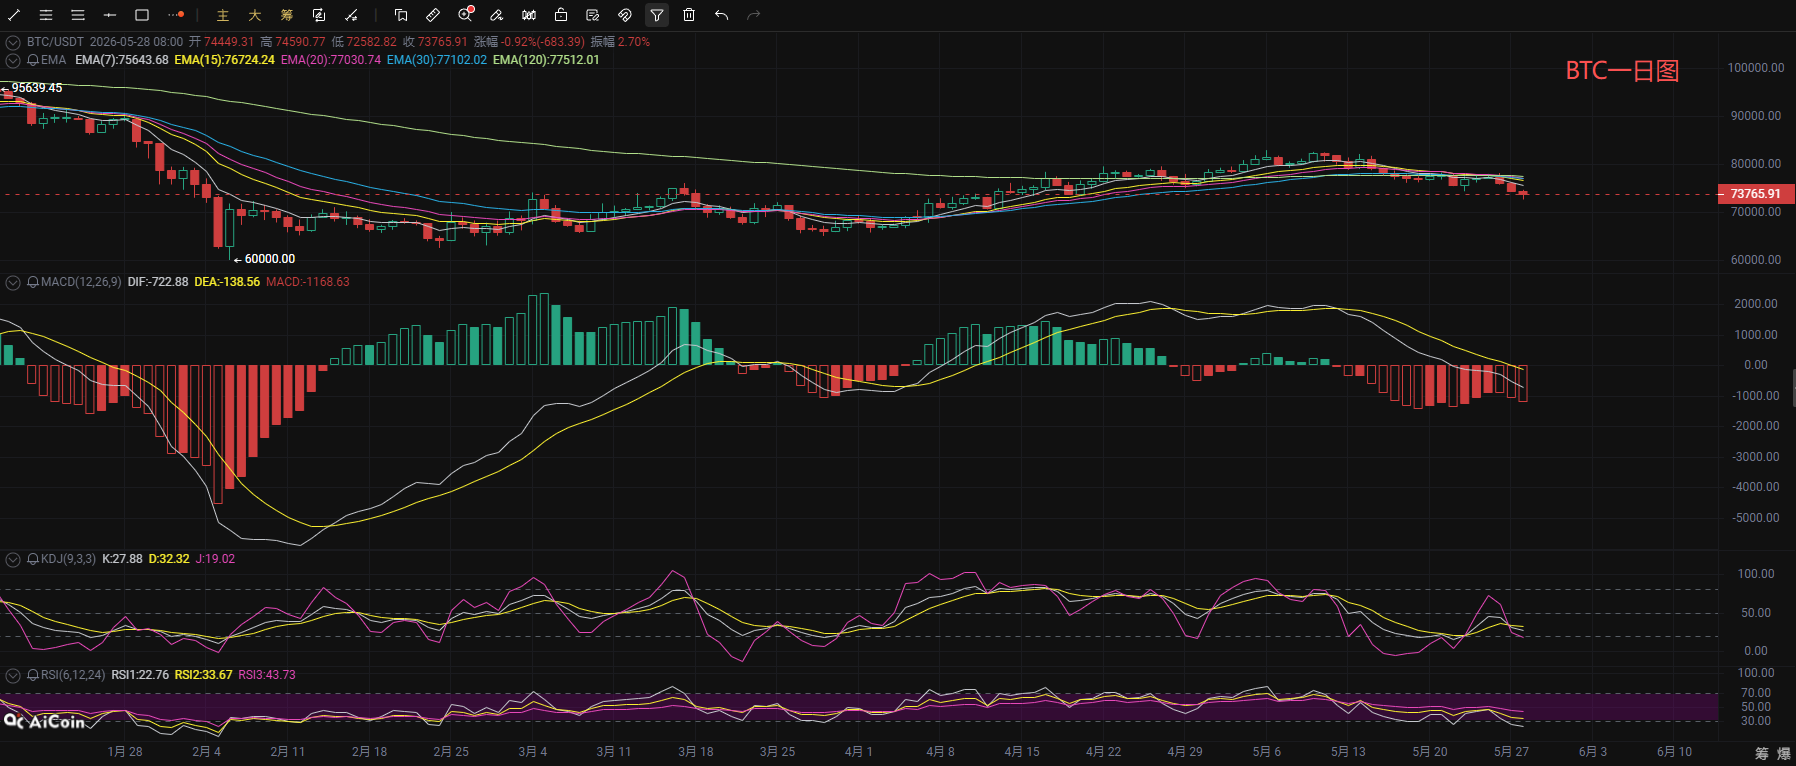
Bitcoin's recent market continues to weaken, currently in a clear downtrend on the daily level, with prices fluctuating near the lower boundary of the Bollinger Bands and short-term support appearing weak. In terms of the moving averages system, the price has fallen below multiple short-term EMA lines, and all short-term moving averages are turning downwards, forming a typical bearish arrangement. Meanwhile, the price has also fallen below the EMA120 moving average, and the mid-term trend is likewise weakening. In the MACD indicator, the DIF line and DEA line continue to run below the zero axis, with the MACD histogram continuously expanding, and there are no apparent signs of a reduction in bearish momentum. The KDJ indicator's three lines are in the oversold range near 20, and no golden cross has formed yet. The RSI indicator shows all three lines below 50, and the short-term RSI1 has dropped to around 22, indicating an oversold state but no clear bottom divergence reversal signal has emerged; the downtrend momentum on the daily level continues, making a strong reversal unlikely in the short term.
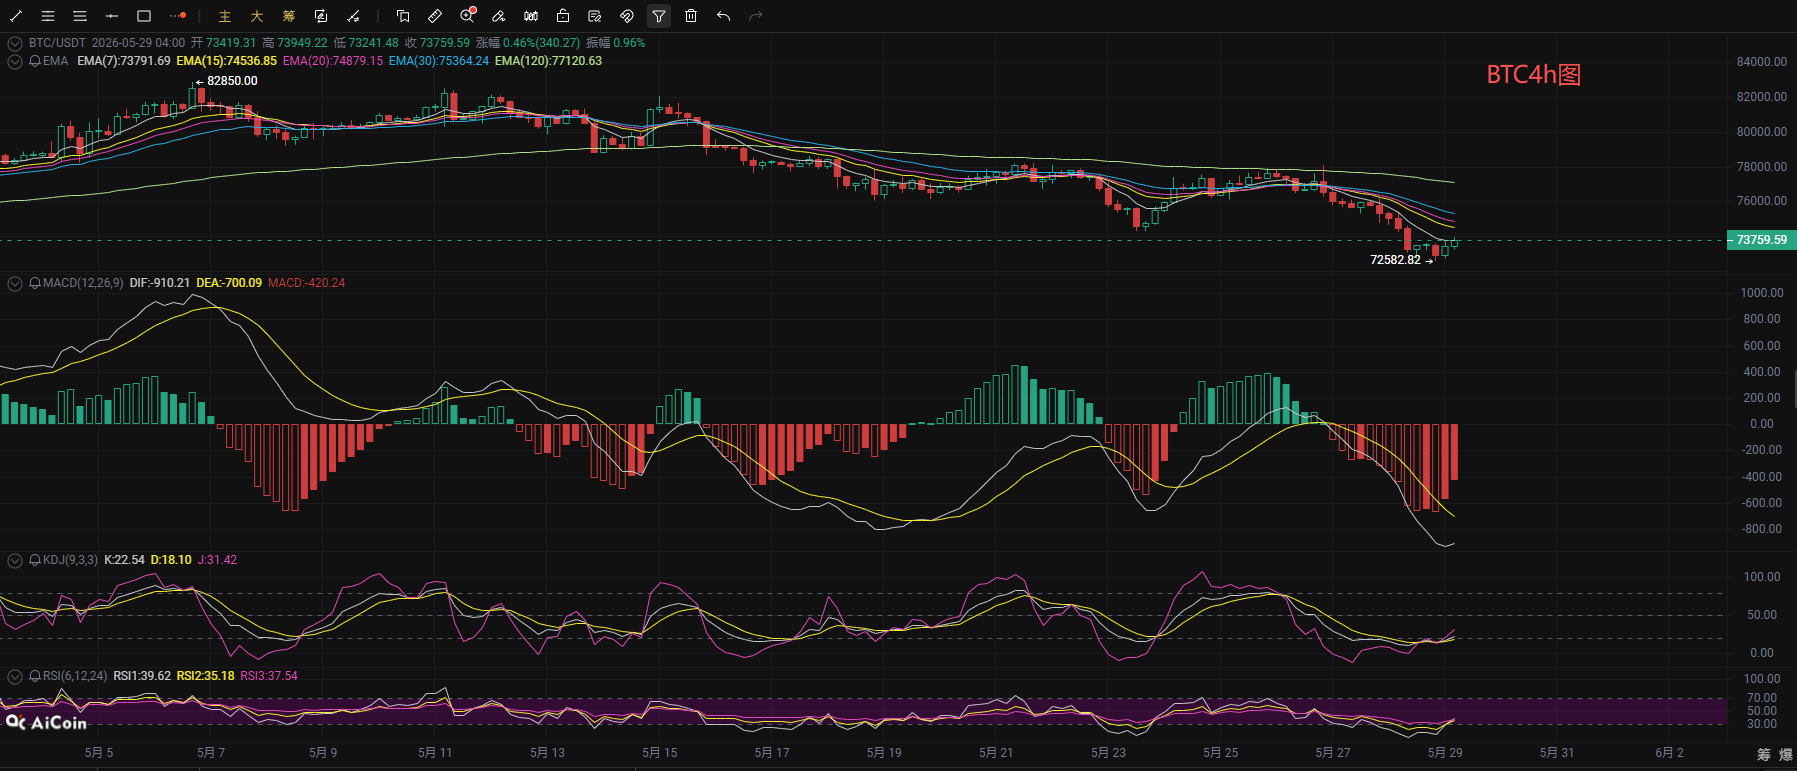
On the short cycle of the 4-hour level, BTC is in a weak consolidation phase following an accelerated decline. The price is currently just above the lower boundary of the Bollinger Bands, which are expanding downwards. The upper and middle bands are continuously pressing down, and the bearish channel is clear. In the moving averages system, the price consistently operates below the EMA lines, and the moving averages have a complete bearish arrangement, with short-term rebounds consistently suppressed by the EMA7 moving average. In the MACD indicator, the DIF line has slightly turned up below the zero axis, showing a slight reduction in bearish momentum; the KDJ three lines are in the oversold area around 20, and a low position golden cross has now formed. Meanwhile, the RSI indicator is gradually rising from the low position. Based on the comprehensive indicators, the short-term market possesses some rebound repair momentum, but the overall downward trend has not reversed. The 75000-76000 range shows clear resistance, and the subsequent rebound space is limited, with intra-day operations mostly focused on selling at highs.
Coin Ocean Waves: 5.29 Bitcoin Short-term Reference:
Long Position: Long in the 72200-73000 range, stop loss 500 points, target 73500-74500,
Short Position: Short in the 75500-74500 range, stop loss 500 points, target 74000-73000,
【The above analysis and strategies are for reference only. Please take risks at your own discretion. The article may be delayed in review and publication and does not possess timeliness. Do not operate blindly!】

The content of this article is original and shared by 【Coin Ocean Waves】, representing only personal views. The article has a delay in transmission and is for reference only. Do not operate blindly! Want to get more daily real-time trades? Then follow my public account! Here, you can learn technical analysis online and understand knowledge related to exiting setups. I have years of research experience in the market, focusing on the major trends in the cryptocurrency sphere. I am mainly responsible for analyzing and guiding investment operations for BTC, ETH, SOL, BCH, and other coins. Welcome to study and research together.
免责声明:本文章仅代表作者个人观点,不代表本平台的立场和观点。本文章仅供信息分享,不构成对任何人的任何投资建议。用户与作者之间的任何争议,与本平台无关。如网页中刊载的文章或图片涉及侵权,请提供相关的权利证明和身份证明发送邮件到support@aicoin.com,本平台相关工作人员将会进行核查。