From the perspective of a professional trader, the current market characteristics are very clear: a sharp drop followed by an oversold rebound, but the overall bearish trend remains unchanged, and the strength of the rebound is questionable.
Key Signal Interpretation
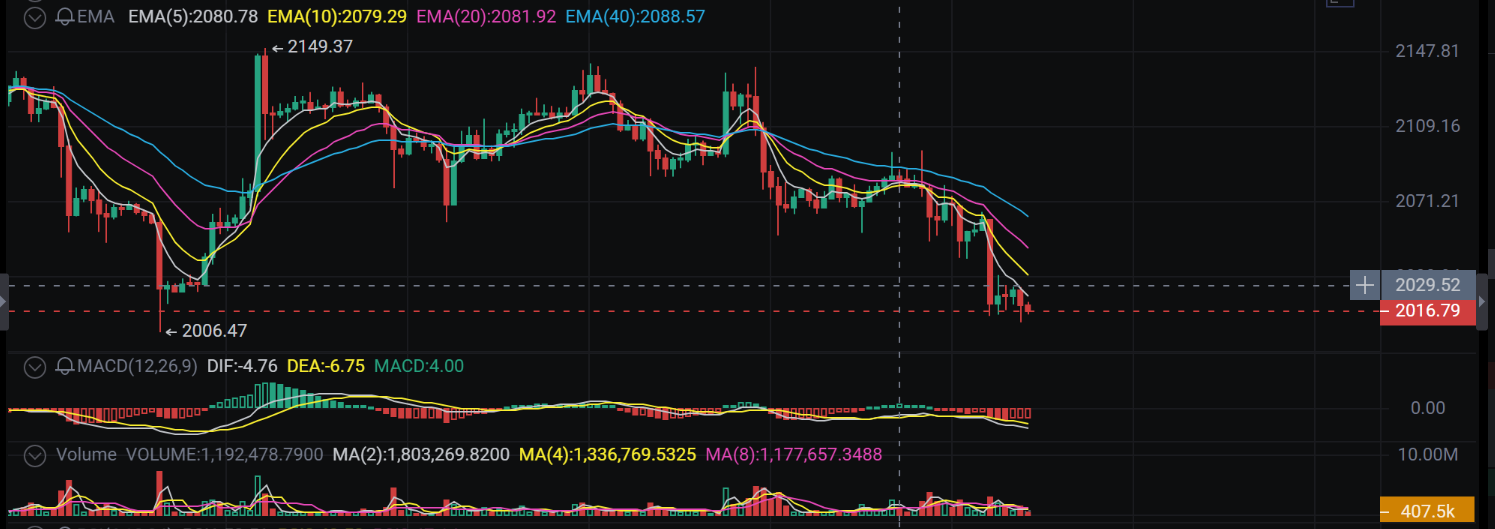
Trend Structure: Bearish Dominance, Moving Average Pressure
Although the price has experienced a sharp drop, it is still operating below all EMA moving averages.
EMA(5), EMA(10), EMA(20), and EMA(40) show a clear bearish arrangement, and the moving averages are diverging downwards. In particular, the EMA(20) and EMA(40) near 2080-2090 create a strong “cap pressure,” which means as long as the price cannot break through 2090 with volume, any rise should be seen as a rebound rather than a reversal.
MACD Indicator: Bottom Divergence Repair Underway
The price has made a new low of 2016.79, but the MACD’s fast and slow lines (DIF and DEA) did not make new lows, and the green bars (bearish momentum) are shortening, even nearing a turn to red.
This is a potential bottom divergence signal, indicating that the downward momentum is waning, and there is a high probability of a corrective rebound returning to the moving averages in the short term.
Trading Volume: Shrinking Volume Consolidation
After the sharp drop, trading volume (Volume) has clearly shrunk. This usually means selling pressure is temporarily reduced, but buying enthusiasm is also lacking, and the market is in a wait-and-see状态, waiting for direction choice.
Trading Strategy Suggestions
Short-term Strategy (Speculative Rebound)
Entry Point: Near the current price of 2029 or when the price retraces to 2020 without breaking, attempt to go long with a light position.
Target Price: The first target for the rebound is at 2060-2080 (moving average pressure zone).
Stop Loss: Set below 2010 (previous low).
Medium-term Strategy (Trend Following Short)
Key Signal: If the price rebounds to the vicinity of 2080-2090 and encounters resistance, and the MACD fails to cross above and turn red, it is an excellent shorting opportunity.
Action: Establish short positions around 2080-2090, setting a stop loss at 2100, with targets looking down to 2020 or even lower.
In summary: The momentum of the sharp drop is weakening, there is a demand for a short-term rebound, but the overall trend remains bearish, and a rebound to the vicinity of 2080-2090 is a good opportunity to short.

Scan the code to follow the public account and communicate with me for more real-time analyses and strategies for free.
免责声明:本文章仅代表作者个人观点,不代表本平台的立场和观点。本文章仅供信息分享,不构成对任何人的任何投资建议。用户与作者之间的任何争议,与本平台无关。如网页中刊载的文章或图片涉及侵权,请提供相关的权利证明和身份证明发送邮件到support@aicoin.com,本平台相关工作人员将会进行核查。