Bitcoin continued to decline yesterday, with the price now dropping to the critical support level of 74000. If this level is breached and stabilizes below, then the downward channel will be directly opened. A reversal may be needed. It is still possible to make one last bullish move here.
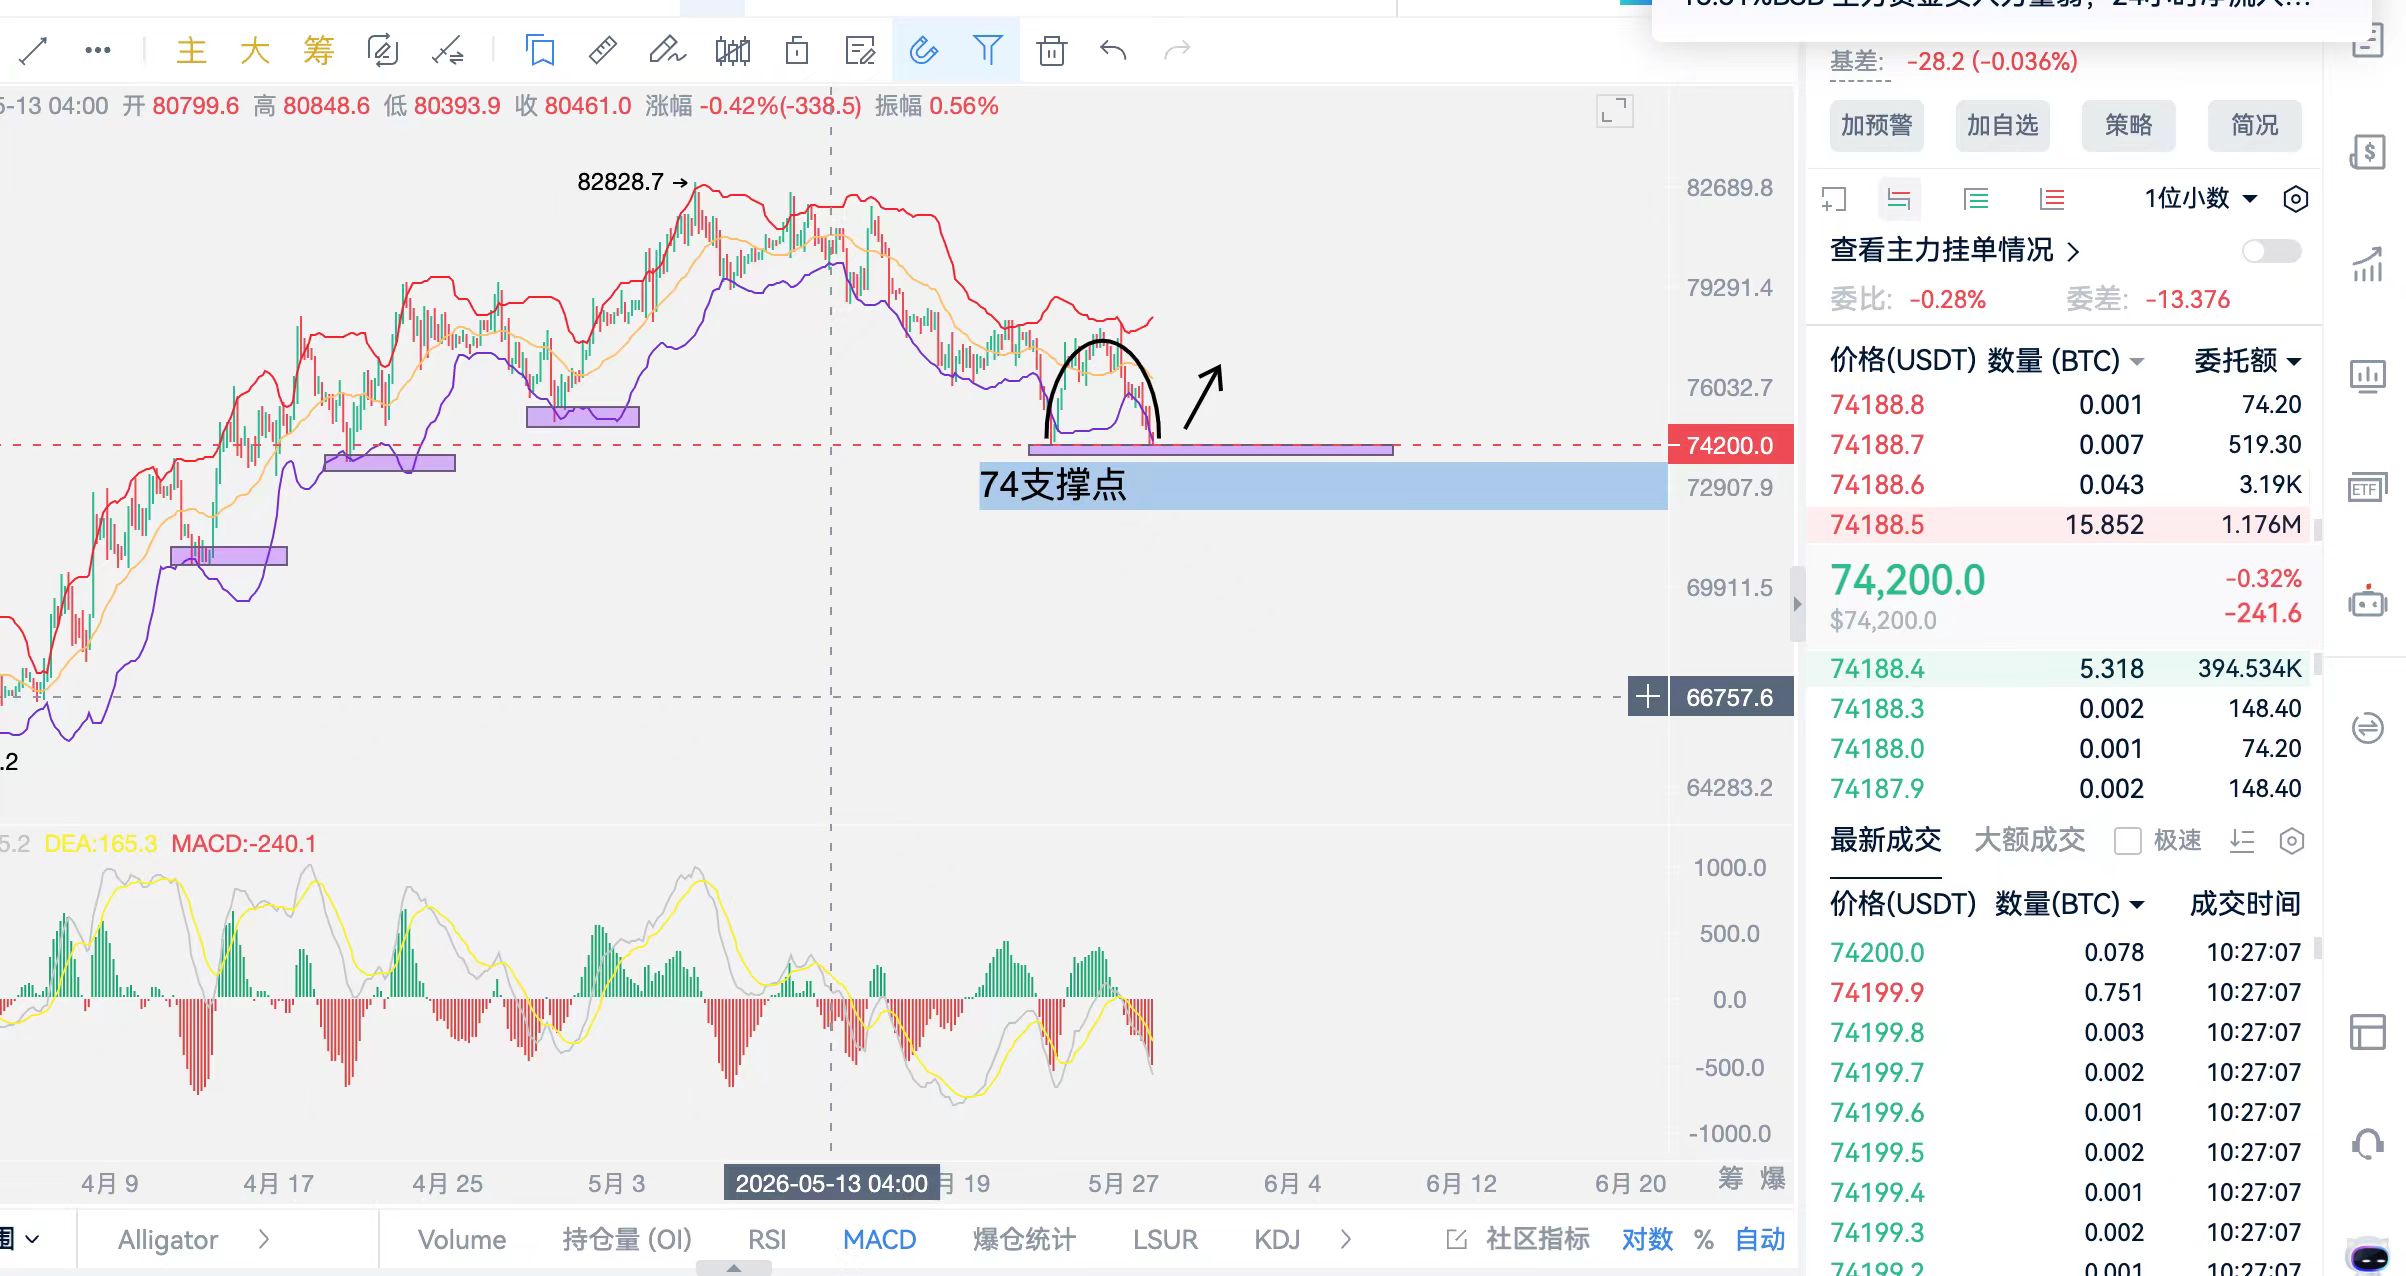
The current price is around 74200 USDT , with the key support level marked in the chart at 74200 (the "74 support point").
The price has formed a pattern similar to a "double bottom" or "rounded bottom" above the support level (the part outlined in black), followed by an upward arrow, which is a typical sign of stabilization and rebound.
The previous high was at 82828.7 , indicating that the current price is in a low volatility zone after a correction.
2. Bollinger Bands (Alligator) Signal
The red, orange, and purple lines in the chart represent the three bands of the Bollinger Bands (or Alligator), and the current price is operating near the middle band. It has not breached the lower band, indicating that short-term downward momentum is weakening.
The bands have gone from convergence to starting to flatten, which also suggests that the range-bound market may soon come to an end and a direction choice is in preparation.
3. MACD Indicator
The DEA line (yellow line) and the MACD histogram are currently below the zero axis, but the green bars have noticeably shortened, indicating that the bearish force is exhausting, and there is a possibility of a golden cross (bullish signal) in the future.
📊 Core Logic and Operational Suggestions
This pattern is a typical combination of "support level stabilization + indicator bullish divergence," and the core logic is:
74200 is a strong support area tested multiple times in the past, and the price halting its decline here indicates strong buying pressure.
If it can stabilize above 74200 and successfully break through the middle Bollinger Band, the rebound target can be aimed at the 78000-80000 range.
If it falls below 74000 and cannot quickly recover, the support level will be invalid, and it may probe down to the next support around 66757 .
⚠️ Risk Warning
1. This is short-term technical analysis, and the cryptocurrency market is highly volatile. Support levels may be breached quickly due to sudden news, so stop-loss measures must be set.
2. The right-side order book shows 74188.5 has a large order of 15.852 BTC, so the price may see repeated contention here in the short term.
From the current price chart, one can look directly for a rebound at this 74200 level. The target is near the aforementioned 78000 level, with the points for reference only.
Follow the official account, and the only way to relieve worries is by Jiang Wei, a treasure analysis blogger full of emotional value, sharing trading education for free, bringing stability and clear guidance in the restless trading market, traversing three cycles of bull and bear markets and years of practical trading experience, skilled in naked K, trends, Dow Theory, Gann, harmonics, Chen Theory, wave theory, and other technical analyses, gathering into unique personal insights.

免责声明:本文章仅代表作者个人观点,不代表本平台的立场和观点。本文章仅供信息分享,不构成对任何人的任何投资建议。用户与作者之间的任何争议,与本平台无关。如网页中刊载的文章或图片涉及侵权,请提供相关的权利证明和身份证明发送邮件到support@aicoin.com,本平台相关工作人员将会进行核查。