Historically, each cycle of Bitcoin from bear market to bottom, in the early, middle, and late stages, will successively show three significant death crosses (let's call it an indicator).
It is worth mentioning that the lowest price point in the second bottom of each bear cycle appears between the second and third crosses, without exception in history.
The black line represents the average cost of Bitcoin purchased by investors holding for 3-6 months; the orange line represents the average cost of Bitcoin purchased by investors holding for 6-12 months; the blue line represents the average cost of Bitcoin purchased by investors holding for 1-2 years.
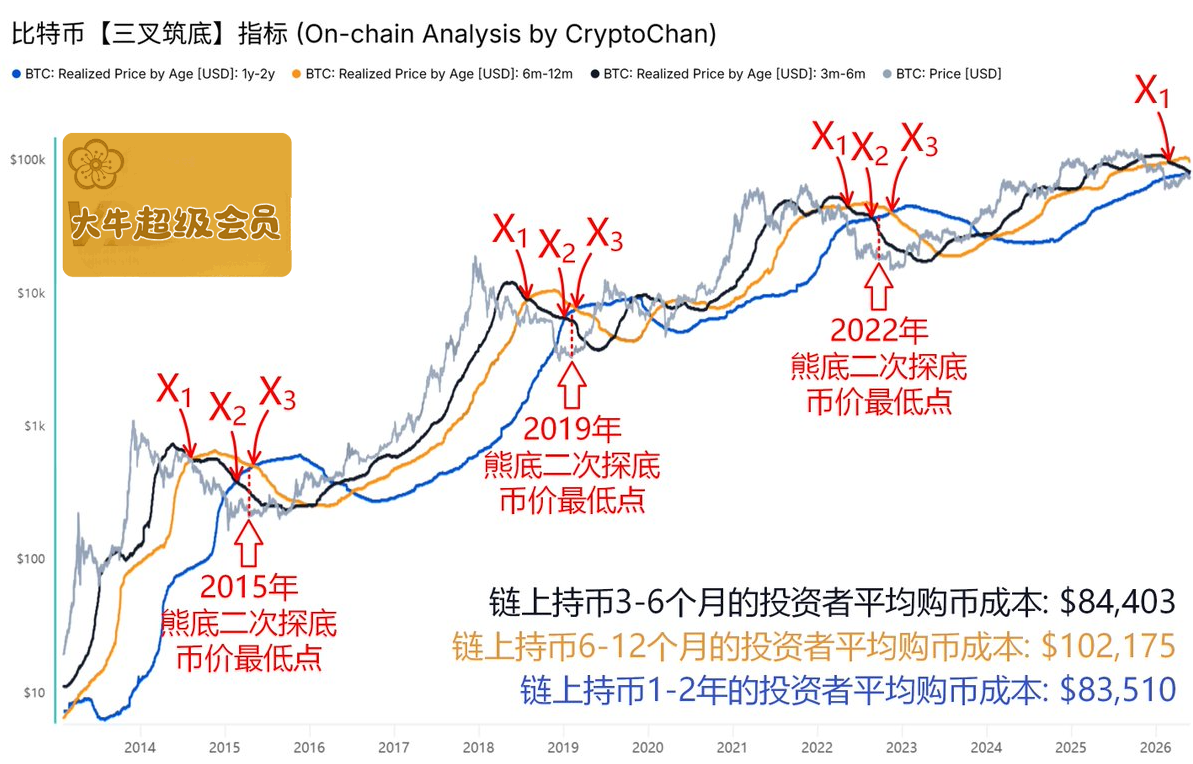
Bear market first cross > In the early stages of historical Bitcoin bear markets, the black line often death crosses the orange line. Bear market second cross > In the middle stages of historical Bitcoin bear markets, the black line often death crosses the blue line.
Bear market third cross > In the late stages of historical Bitcoin bear markets, the orange line often death crosses the blue line.
It is worth mentioning that —
2015: The lowest price point of Bitcoin during the second bottom of the bear market appeared between the second and third crosses. 2019: The lowest price point of Bitcoin during the second bottom of the bear market appeared between the second and third crosses. 2022: The lowest price point of Bitcoin during the second bottom of the bear market appeared between the second and third crosses.
This round's bear market first cross has been completed, and there are still 893 dollars to the second cross.
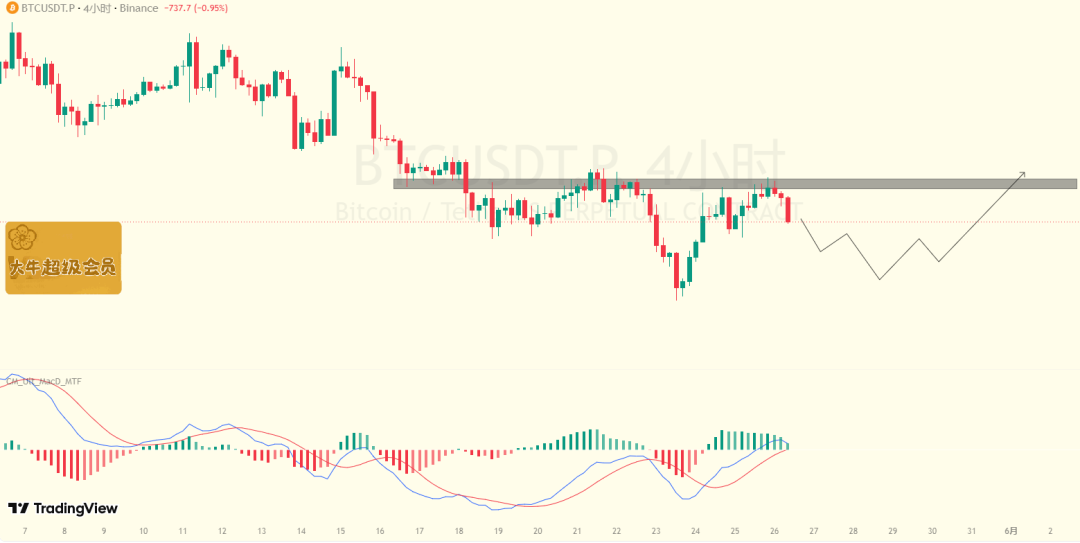
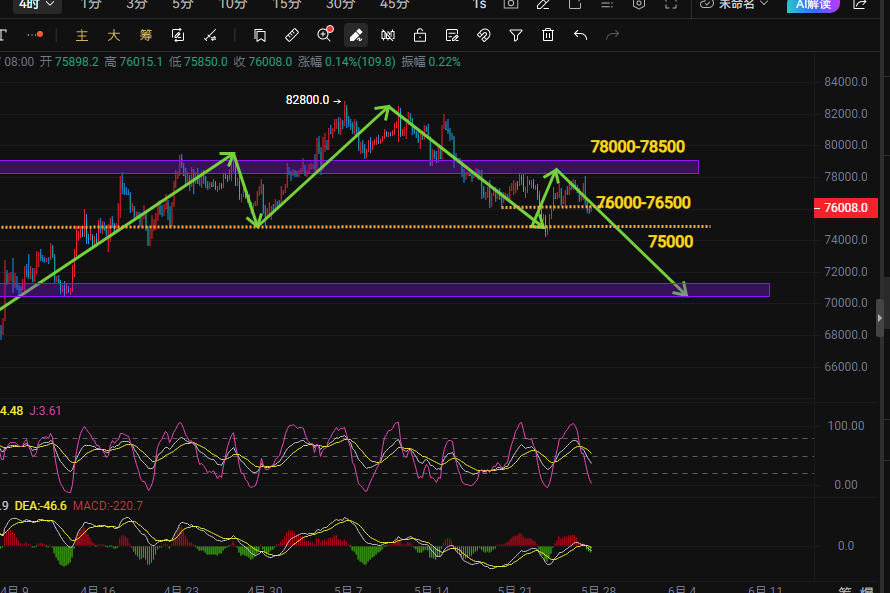
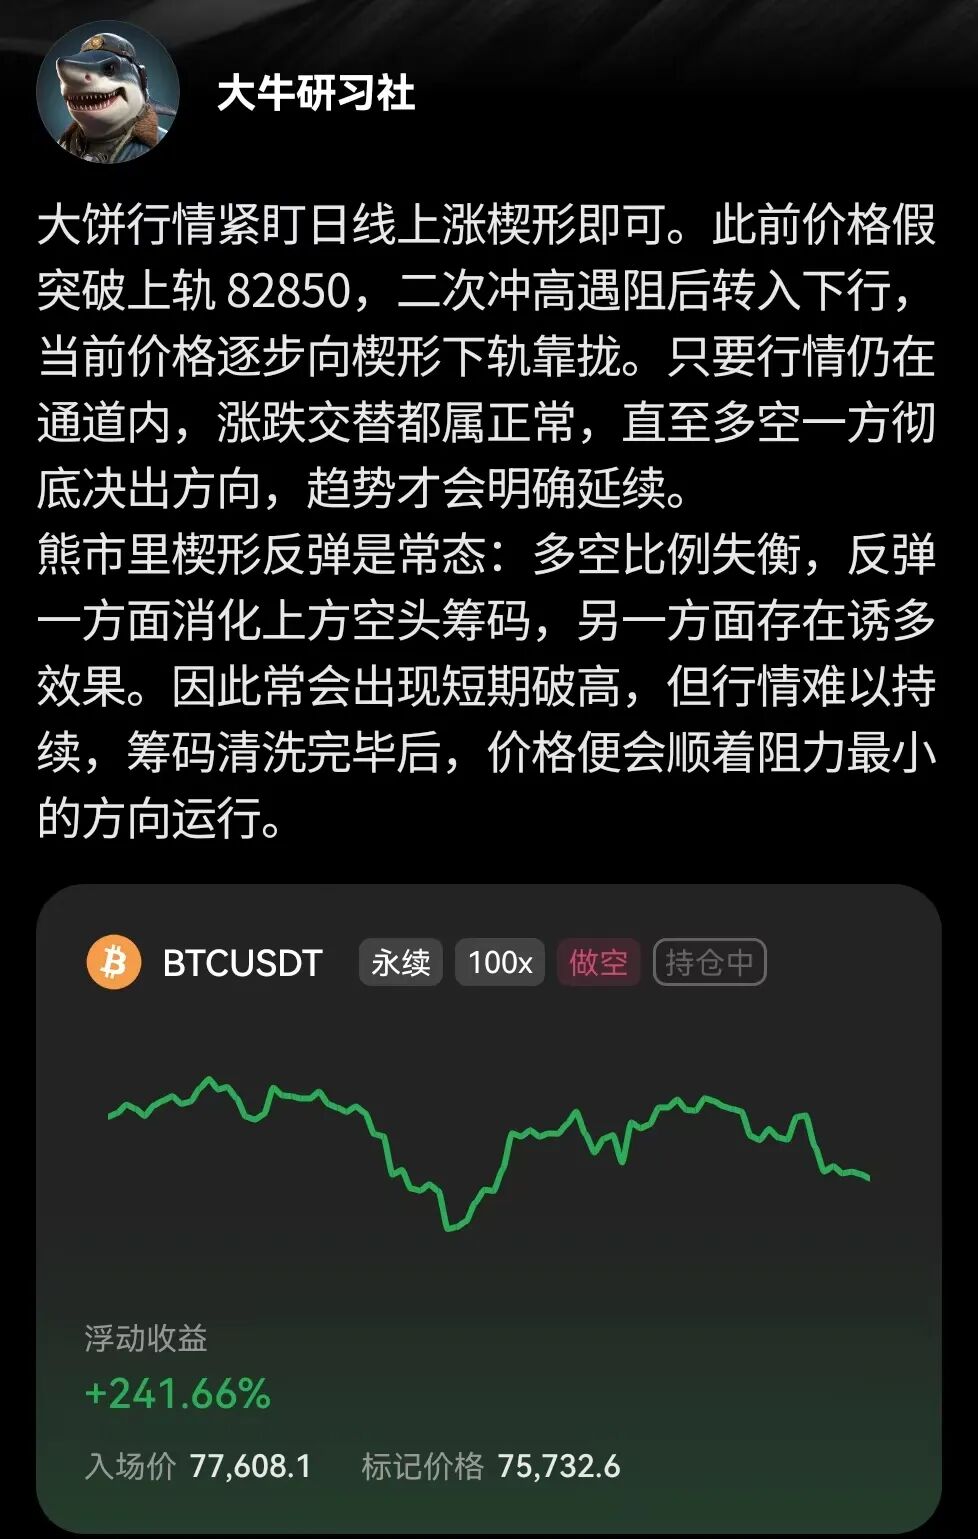
Bitcoin 4 hour cycle, the bearish rhythm is very clear. Yesterday, the price tested 78000 again but failed to break through; early morning bears directly released volume to crash the market, and the signals of market weakness are very clear; in the 4-hour structure, the bearish trend is still continuing.
On the indicator side, the bullish momentum of MACD has been continuously shrinking, and the fast and slow lines are about to form a death cross. The signals of decline and K-line movement have resonated, indicating that bearish strength is taking over, and the market is likely to continue to decline.
The ideal path is for the price to first pull back to around 74000-74500, forming a double bottom structure, releasing the bearish momentum cleanly, and after a sufficient adjustment, initiate a technical rebound.
In the current market environment, the trading strategy needs to be clear: only bearish trades should be made during the day without participating in any bullish speculation, avoiding being trapped by bottom fishing in a weak market. If the price later enters a sideways adjustment phase, patiently observe for signs of support stabilization or pressure breakthrough, and it's not too late to adjust the strategy.
Don’t bet on direction, only follow trends, friends. Floating profits are just a byproduct of going with the trend.
Public Account: Da Niu Says Market Trends
Disclaimer: The above content is only a personal sharing of market views and does not constitute any investment advice. Cryptocurrency markets are highly volatile and carry significant risks. Investors should make independent judgments and operate rationally, taking responsibility for their own profits and losses.
免责声明:本文章仅代表作者个人观点,不代表本平台的立场和观点。本文章仅供信息分享,不构成对任何人的任何投资建议。用户与作者之间的任何争议,与本平台无关。如网页中刊载的文章或图片涉及侵权,请提供相关的权利证明和身份证明发送邮件到support@aicoin.com,本平台相关工作人员将会进行核查。