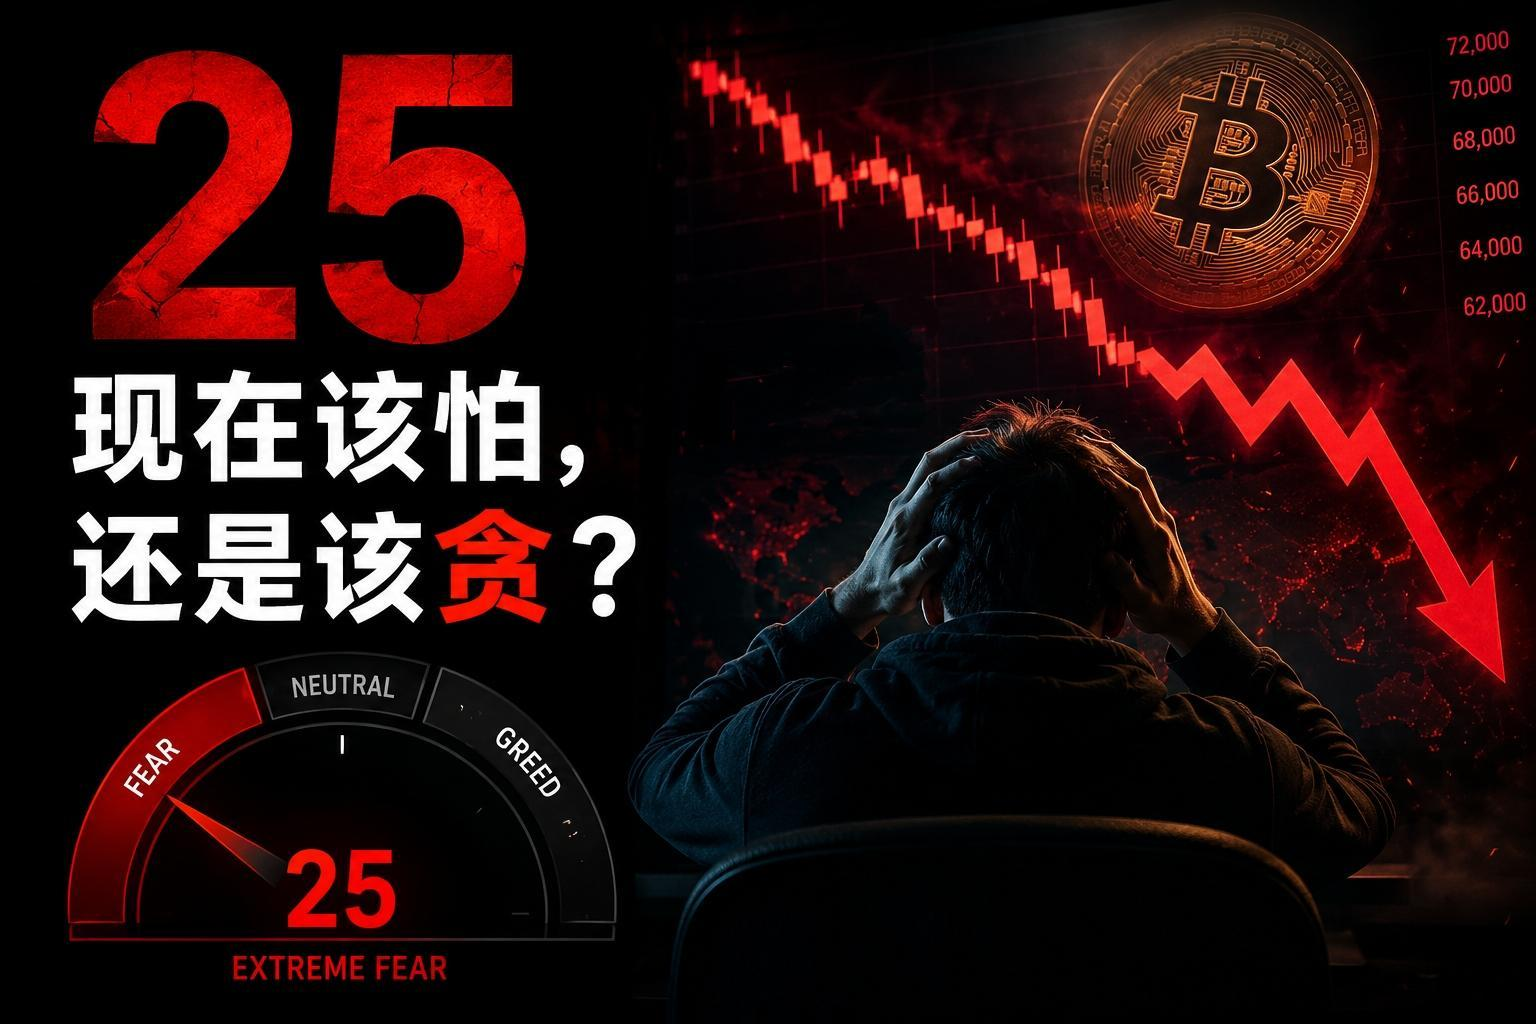
Dear friends, I am Qinglan. Today, the market sentiment is a bit complex, so we will focus on two heavy news items. The first is that Federal Reserve's Kashkari made hawkish comments, warning that a prolonged war with Iran could trigger a series of interest rate hikes, which directly suppressed risk asset preferences, causing BTC and ETH to face significant pressure. The second is that the entire network suffered liquidations of 278 million dollars, with both longs and shorts being wiped out within 24 hours, exposing the market's fragility. These two pieces of news combined indicate that the current uncertainties in geopolitical situations and monetary policy are core factors suppressing prices, and bulls need to be particularly cautious in the short term.
Current Price and Time
The current time is May 27th, 09:05, with the latest BTC quote at 76,052 USDT, reflecting a 24-hour decline of 1.8%. The Fear and Greed Index has fallen to 34, in the fear zone, indicating that market sentiment leans towards pessimism, with significant funds in a wait-and-see mindset.
Multi-Cycle State Overview
First, let’s look at the daily level. The daily MA5 is at 76,624, MA10 at 76,766, and MA30 at 78,476. The current price of 76,052 is clearly below all moving averages, showing a bearish arrangement. The MACD's DIF is -381.42, DEA is 35.92, and histogram is -417.33, indicating ongoing expansion of bearish momentum. The RSI is at 36.62, close to the oversold zone but not fully entered, suggesting that the downtrend has not yet ended.
4-Hour Level. The 4-hour MA5 is at 76,347, MA10 at 76,752, and MA30 at 76,556, with prices also running below the moving averages. The MACD's DIF is -153.50, DEA is -41.91, and histogram is -111.59, with bearish momentum continuing to strengthen. The RSI is at 40.70, in a weak zone, indicating insufficient rebound strength.
1-Hour Level. The 1-hour MA5 is at 75,941, MA10 at 76,019, and MA30 at 76,642. Prices linger near MA5 and MA10, but MA30 presents clear pressure. The MACD's DIF is -296.84, DEA is -259.09, and histogram is -37.76. Although the histogram has shortened, both DIF and DEA remain below the zero axis, indicating that the bearish trend has not changed. The RSI is at 28.36, entering the oversold zone, with a potential technical rebound in the short term, but strength is doubtful.
15-Minute Level. The 15-minute MA5 is at 76,004, MA10 at 75,945, and MA30 at 75,960, with prices oscillating near the moving averages. The MACD's DIF is -59.14, DEA is -105.67, and histogram is 46.53, showing signs of a golden cross, but a golden cross below the zero axis is usually seen as a weak rebound. The RSI is at 53.19, in the neutral zone, indicating that the forces of bulls and bears are relatively balanced in the short term.
TPV Signal Verification
Now, let's use the Qinglan TPV system to verify the signal. First, looking at trend positioning, the current value of the 1-hour EMA55 is 76,666.20, while BTC's price of 76,052 is significantly below EMA55, indicating that it is currently in a bearish trend zone. Oscillation auxiliary data shows that in the past 8 one-hour candles, the closing price greater than EMA55 occurred 0 times, and the crossing occurred 0 times. The absolute amplitude distance from EMA55 is 0.80%, which does not meet the oscillation threshold, indicating that the market is in a one-sided bearish trend.
Short-Selling Condition Verification. First, the price is under pressure below the 1-hour EMA55. Two consecutive hourly candles have closed below EMA55, this condition is met. Second, pressure meets resistance. From the 15-minute chart, the price has frequently shown long upper shadows in the 76,000-76,200 range, indicating clear selling pressure above. Third, the rebound is weak. The histogram of the 1-hour MACD has shortened, but DIF and DEA are still below the zero axis, and the RSI has limited recovery from 28.36, indicating insufficient rebound momentum. Overall, the conditions for short-selling are essentially met, but we need to wait for a clearer entry signal.
On-Chain Fund Situation
On-chain data shows, with a Fear and Greed Index of 34, in the fear zone, indicating that retail investor sentiment is pessimistic, but this is often a time for major players to accumulate positions. BTC market share data is currently lacking, but combined with the liquidation of 278 million dollars, it suggests that the market leverage ratio is high, and after the double kill of longs and shorts, funds may further flow out. In terms of geopolitical situations, US-Iran negotiations are at a standstill, with Iran threatening to block oil exports, and oil prices skyrocketing past 96 dollars, all of which exacerbate inflation fears, thereby reinforcing the Federal Reserve's interest rate hike expectations, continuously suppressing risk assets.
Key Support and Resistance Levels
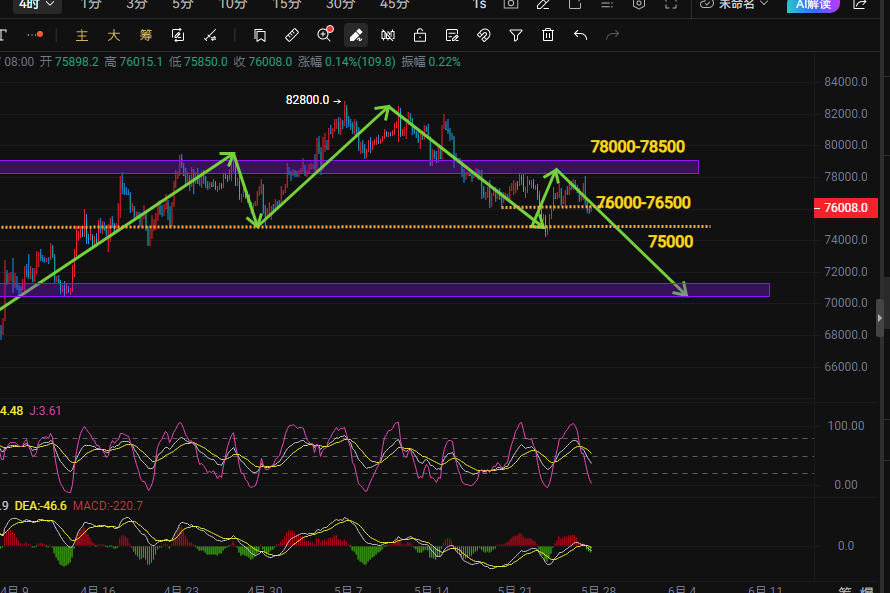
The current key support level is in the 75,500-75,800 range, which is a dense area of previous lows, and if broken, it could accelerate the decline to 74,000. The resistance level above is in the 76,600-77,000 range, corresponding to the resonance pressure of the 1-hour EMA55 and the 4-hour MA5. If the price rebounds to around 76,600 and cannot stabilize, bears will continue to dominate. The short-term oscillation range can be referenced at 75,500-76,600.
Trading Thought
Based on the short-selling signal from the Qinglan TPV system, the current trading thought is to focus on high shorts, but confirmation of a rebound is needed.
Direction: Short.
Entry Conditions: Wait for the price to rebound to the 76,500-76,600 range, and for the 15-minute chart to show a long upper shadow or top formation, while the MACD histogram begins to shorten, confirming insufficient rebound strength before entering. If the price directly breaks below 75,500, a light short position may be pursued, but strict stop-loss must be observed.
Stop-Loss Position: Set above 77,050, which indicates a breakthrough and stabilization above the 1-hour EMA55, suggesting that the short signal is invalidated.
Target Position: First target is 75,500, second target is 74,000. If the price shows increased volume stagnation or bottom formation near 75,500, partial profit-taking may be considered.
Risk Warning
Uncertainties in geopolitical situations and Federal Reserve policies may lead to significant market fluctuations, it is advised to control positions, strictly set stop-loss, and avoid heavy positions.
Follow Qinglan Crypto Classroom for more trading opportunities! Welcome to visit the official website www.qinglan.org
📊 Qinglan TPV Trading Strategy Backtest Reference
🕒 Last Backtest Time 05-27 07:00:01
Total Analysis: 1814 Backtests: 1604 Accuracy Rate: 67% (1074/1604)
免责声明:本文章仅代表作者个人观点,不代表本平台的立场和观点。本文章仅供信息分享,不构成对任何人的任何投资建议。用户与作者之间的任何争议,与本平台无关。如网页中刊载的文章或图片涉及侵权,请提供相关的权利证明和身份证明发送邮件到support@aicoin.com,本平台相关工作人员将会进行核查。