Cryptocurrency Academy: On May 19, multiple technical indicators diverged; the downside space for Ethereum has already opened! Latest market analysis and trading advice.
The current price of Ethereum is 2105. To be honest, my own judgment resulted in my regretful exit from this wave of decline. I have been educated by the market. The market is always right; our obsession is what is wrong. Don’t hold positions, never go all in, and don’t go against the trend. From the peak above 2400, it has been falling, and the market sentiment is continuously cooling. So, is it an opportunity to buy the dip or a trap now? Today, I will combine the daily K-line and the 4-hour chart to provide a comprehensive breakdown of the market, helping you clarify the current direction and key points.
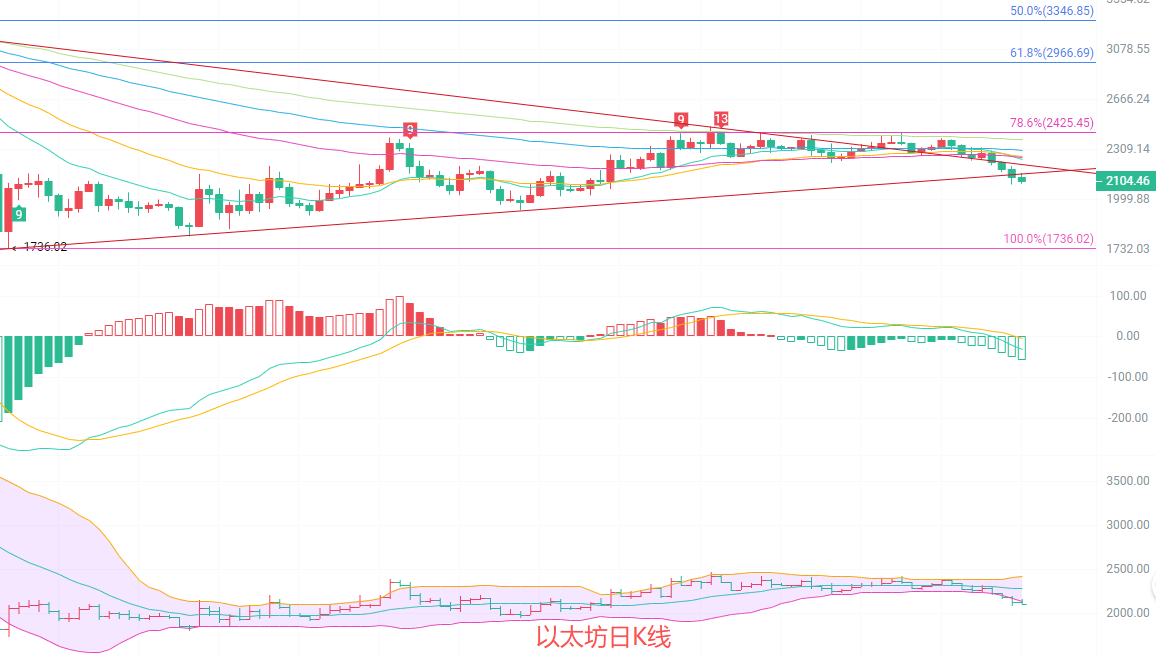
The daily K-line has broken below all MA15/30/60/90/120 moving averages, with a clear downward trend. The MACD's DIF and DEA have crossed downwards, and the green bars are continuously expanding, indicating sufficient downward momentum. The Bollinger Bands are opening downwards; after the price broke below the middle line, it headed straight for the lower line, which is supported around 2136. The price is currently running below the lower line, and the trend is clearly in a downward channel, making significant reversals difficult in the short term.
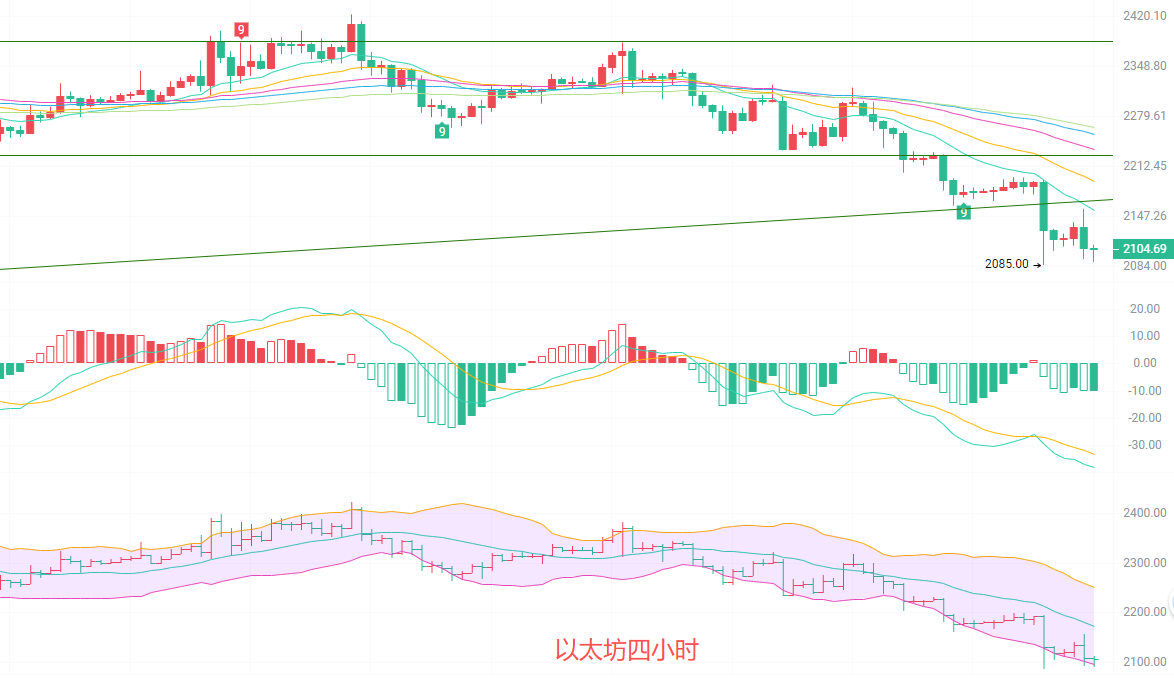
The 4-hour K-line has been declining from a high of 2422. The moving averages are aligned downwards, and the price continues to face pressure below all EMAs. Although the MACD has shown volume reduction after the death cross below the zero axis, there hasn't been a clear golden cross signal, and the rebound strength is very weak. The Bollinger Bands are continuously expanding; the price is operating along the lower line, and each rebound touching the middle line is an opportunity to go short. Currently, the price is slightly fluctuating around 2105, which is a continuation of the decline, and the weak pattern remains unchanged.
Short-term reference:
From 2180 to 2200 going south, stop loss at 2230, target looking at 2080 to 2050, breaking looking at 2000.
Long strategy: Currently, it is not recommended to buy the dip. If the price effectively breaks below 2080, it’s best to wait and see; if it stabilizes and rebounds, if it first stands above 2150 and the 4-hour closes firmly, one can cautiously try to go long with a small position, stop loss at 2080, target looking at 2200-2230.
Specific operations should primarily rely on real-time data; for more information, please consult the author. The article's release has a delay, and suggestions are for reference only, with risks borne by the reader.

Reminder: The content above is solely created by the author on Weibo. For the official account, directly search: Cryptocurrency Academy. Any advertisements at the end of the article and in the comments section are unrelated to the author. Please discern carefully, and thank you for reading.
免责声明:本文章仅代表作者个人观点,不代表本平台的立场和观点。本文章仅供信息分享,不构成对任何人的任何投资建议。用户与作者之间的任何争议,与本平台无关。如网页中刊载的文章或图片涉及侵权,请提供相关的权利证明和身份证明发送邮件到support@aicoin.com,本平台相关工作人员将会进行核查。