Cryptocurrency Academic: In-depth analysis of the essence of ETH's low-level fluctuations on May 18, the bull-bear turning point has quietly emerged! Latest market analysis and operation suggestions
Ethereum's current price is 2180. The market is stuck, unable to fall or rise significantly; it is now a typical stage of consolidation at the bottom. Daily fluctuations are just a few tens of points, making it uncomfortable to go long or short. Many people ask me when there will be a reversal. To be honest, I don’t know; we can only follow the trend. Don’t be too greedy, take small profits and exit, and if you make a mistake, don’t hold onto your positions. Setting a stop loss is more important than anything else. Don’t listen to others saying it will definitely rise or fall; there are no guarantees in the cryptocurrency market. Controlling risks and staying alive is the most important thing.
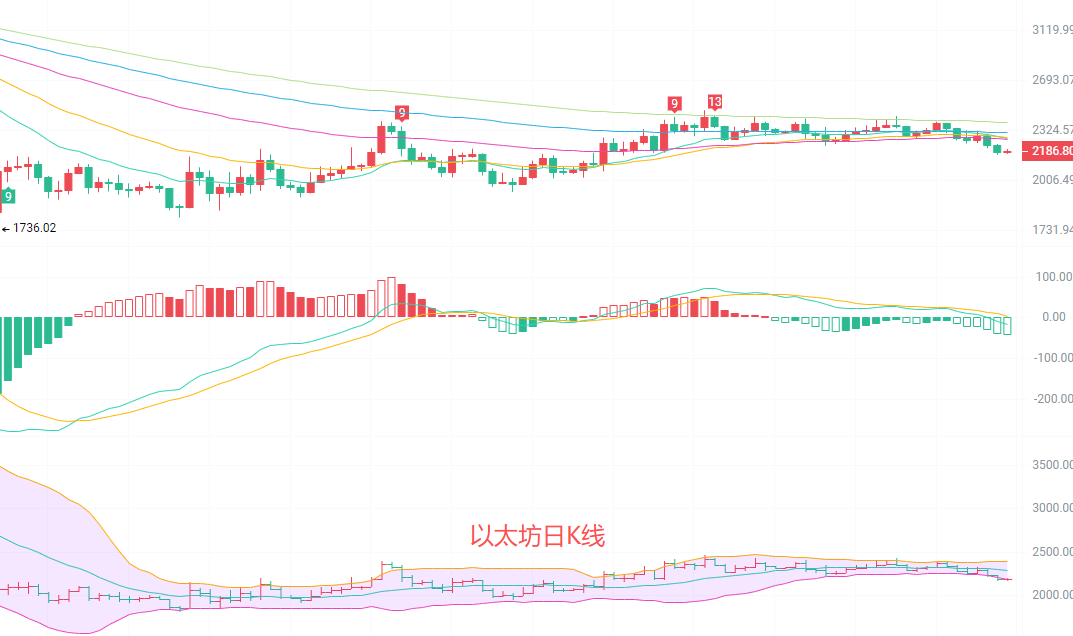
The daily K-line is in a stage of consolidation after a downward trend. The three moving averages EMA15, EMA30, and EMA60 are arranged downward; the price is consistently below these moving averages, indicating a bearish mid-term trend. The MACD indicator shows that the DIF has fallen below the DEA, with green energy bars continuing to expand, and downward momentum is still being released. Regarding the Bollinger Bands, the price is running along the lower band, with the upper and lower bands continuing to converge, indicating a lack of significant rebound momentum in the short term. The key support level is near 2180, while the resistance level is first observed at 2220.
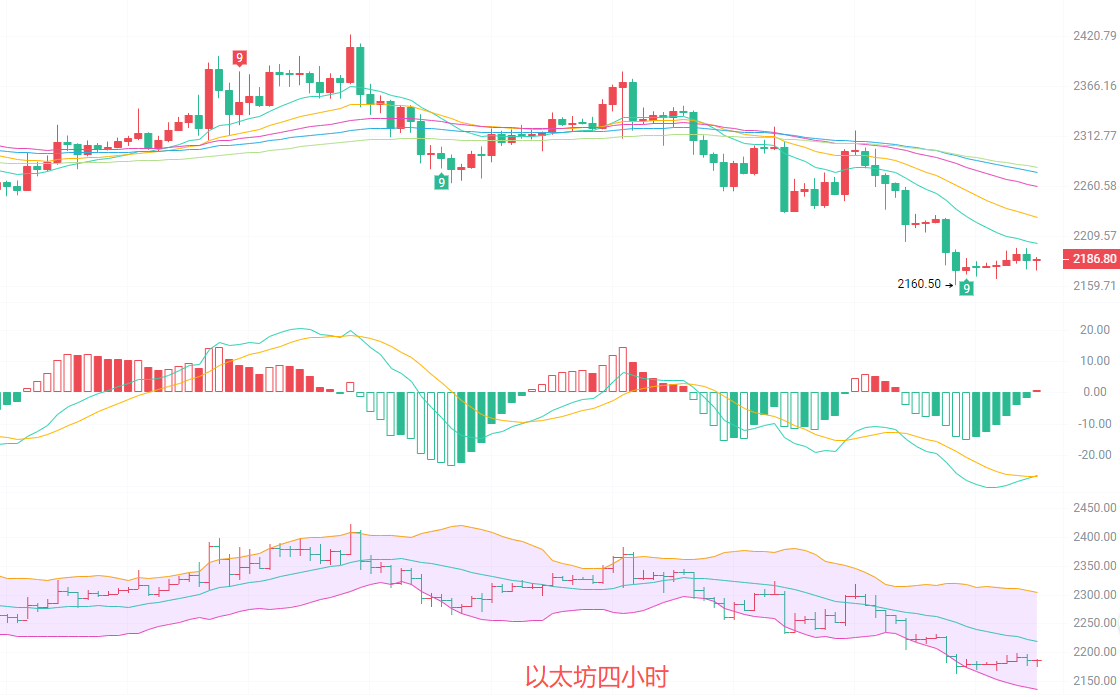
The four-hour K-line is in a low-level horizontal consolidation phase, with prices fluctuating narrowly between 2160 and 2200. In the short term, the EMA15 and EMA30 moving averages continue to trend downward, with price rebounds facing resistance at the EMA15 moving average. Currently, the EMA15 is around 2202, applying visible pressure on prices. The MACD indicator shows a golden cross of DIF and DEA below the zero line, with weak expansion of the red energy bars, indicating a slight demand for short-term rebounds, but the strength is extremely weak. The Bollinger Bands are opening downwards, with prices running between the lower band and the middle band. The lower band at 2135 forms short-term support, while the upper band at 2304 forms strong resistance. The short-term remains within a bearish channel.
Short-term reference:
For downward movement from 2200 to 2230, set a stop loss at 2250, with targets set between 2160 and 2100. If it breaks down, watch for 2080.
Aggressive traders can lightly go long in the range of 2170-2175, with a stop loss set below 2155, targeting the 2200-2220 range; conservative traders need to wait until the price stabilizes above the EMA15 moving average and the MACD volume expands before entering.
Specific operations should be based on real-time market data. For more information, you can consult the author. There may be a delay in article publication; suggestions are for reference only, and risks are borne by yourselves.

Warm reminder: The above content is solely created by the author on Weibo. The advertisements at the end of the article and in the comments section are not related to the author. Please be cautious and discern carefully. Thank you for reading.
免责声明:本文章仅代表作者个人观点,不代表本平台的立场和观点。本文章仅供信息分享,不构成对任何人的任何投资建议。用户与作者之间的任何争议,与本平台无关。如网页中刊载的文章或图片涉及侵权,请提供相关的权利证明和身份证明发送邮件到support@aicoin.com,本平台相关工作人员将会进行核查。