Academician of the Cryptocurrency Circle: Bitcoin is under pressure at the 78,000 mark on May 18! Dissecting the dual-cycle structure, can we accurately predict the direction of future market changes? Latest market analysis and trading suggestions
Bitcoin's current price is 78,100, and the market is treading water just like yesterday. The 78,100 range oscillation is merely the normal state of the market. There is no need to dwell on short-term profits and losses; market trends have their own rules, and insisting on otherwise will not yield results. Ultimately, trading comes down to patience and perspective, not just technique. Following the trend makes it easy to profit, while going against it brings all kinds of suffering. Keep a calm mindset and treat every trade rationally, without being swayed by market emotions. Maintain your rhythm, follow your trading plan diligently, hold your positions calmly, and exit gracefully. The ultimate goal is to establish a lasting presence in the market.
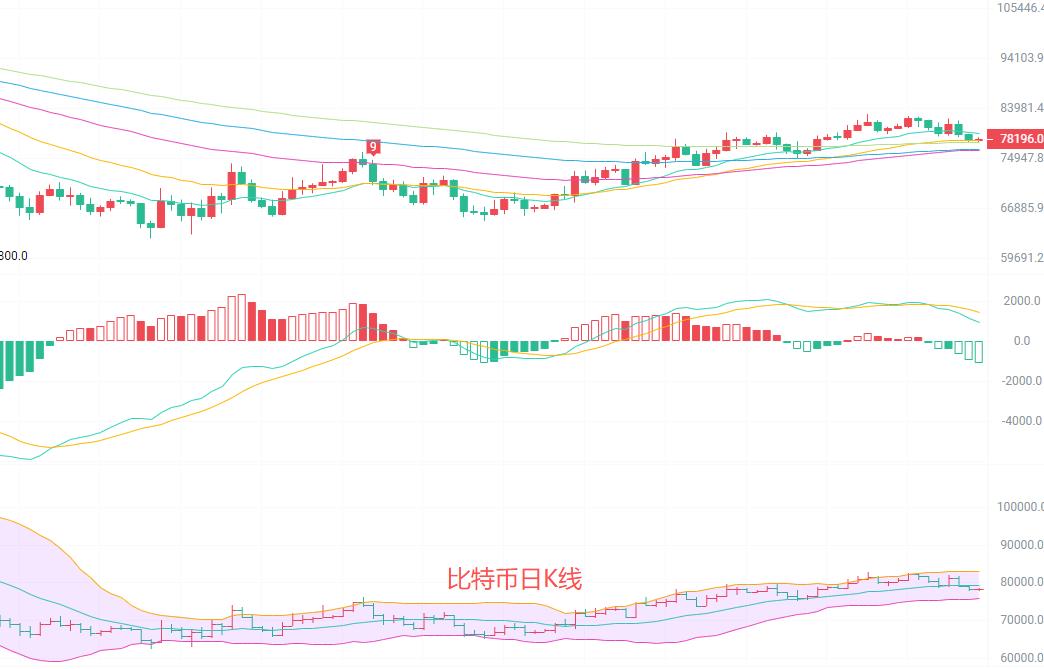
The daily K-line is below EMA15 and above EMA30/60/90/120. Overall, the moving averages are arranged upward, but the short-term EMA15 is beginning to flatten, exerting pressure on the price. The MACD indicator DIF and DEA are still above the zero axis, but the red bars continue to shorten, indicating that upward momentum is gradually waning. The middle track of the Bollinger Bands is continuously moving up, with the price running closely to this middle track. The opening between the upper and lower tracks is narrowing, compressing the oscillation range to 75,740 - 82,910. Overall, the daily line is still in a pullback phase of the upward trend, with intensified long-short battles and no clear trend reversal signal yet appearing.
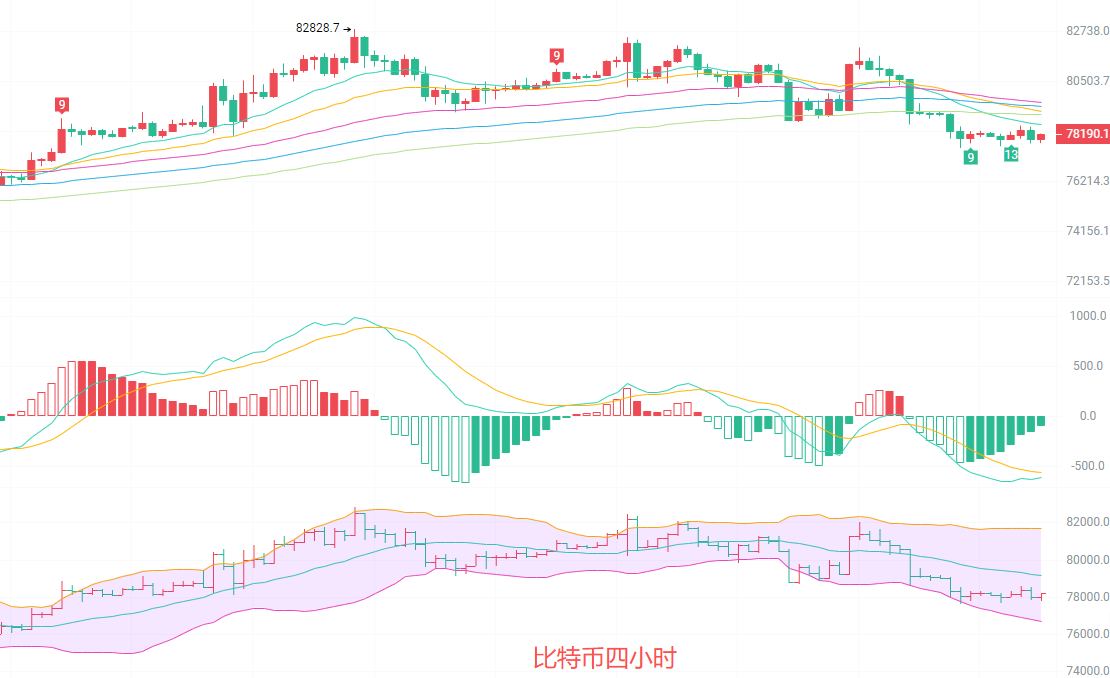
The four-hour K-line is below EMA15, and the EMA30/60/90/120 moving averages are starting to turn downwards, forming a dead cross that imposes pressure on the price. The MACD indicator DIF and DEA have fallen below the zero axis, with green bars continually expanding, indicating that the downward momentum is dominant. The Bollinger Bands are opening downwards, and the price is running along the lower track, with current support near 76,692, while resistance is near 81,696. The four-hour cycle shows a weak short-term trend, as the price has broken below the previous oscillation platform, releasing downward pressure. However, there is significant support from a previous dense transaction area near 77,000, so caution is needed regarding a potential rebound from overselling.
Short-term strategy reference: Align with the longer-term trend, utilize small stops for quick entries and exits.
For upward movement from 77,000 to 77,500, stop loss at 76,500, target at 79,000 to 79,500.
For downward movement from 78,500 to 79,000, stop loss at 79,500, target at 78,000 to 77,200.
Currently, the market does not have a clear one-sided direction. Avoid heavy positions and chasing trades; strictly enter at predetermined levels, and ensure proper stop loss and take profit practices. In a choppy market, focus on short-term trading, patiently wait for effective breakouts before following the trend, prioritize capital preservation, and seeking stable profits is the way for long-lasting trading.

Friendly reminder: The above content is solely created by the author on Weibo. Advertisements at the end of the article and in the comments section are unrelated to the author, so please discern carefully. Thank you for reading.
免责声明:本文章仅代表作者个人观点,不代表本平台的立场和观点。本文章仅供信息分享,不构成对任何人的任何投资建议。用户与作者之间的任何争议,与本平台无关。如网页中刊载的文章或图片涉及侵权,请提供相关的权利证明和身份证明发送邮件到support@aicoin.com,本平台相关工作人员将会进行核查。