Cryptocurrency Academy: The lower Bollinger Band continues to decline on May 17! Ethereum's downward channel, no one can stop it! Latest market analysis and trading suggestions
The current price of Ethereum is 2176, and the second round is messing with the mentality again! What was promised as a rebound has turned into a crash, and now at 2176, it's all tears. I know many people, like me, doubted life after being stopped out back and forth yesterday, sometimes thinking about chasing a short when it breaks, and sometimes thinking about bottom fishing on a rebound, only to get hit on both sides. The current market is typically dominated by the south, while the north has no strength to resist at all. Every small rebound is an opportunity for the south, while the north cannot organize an effective counterattack at all.
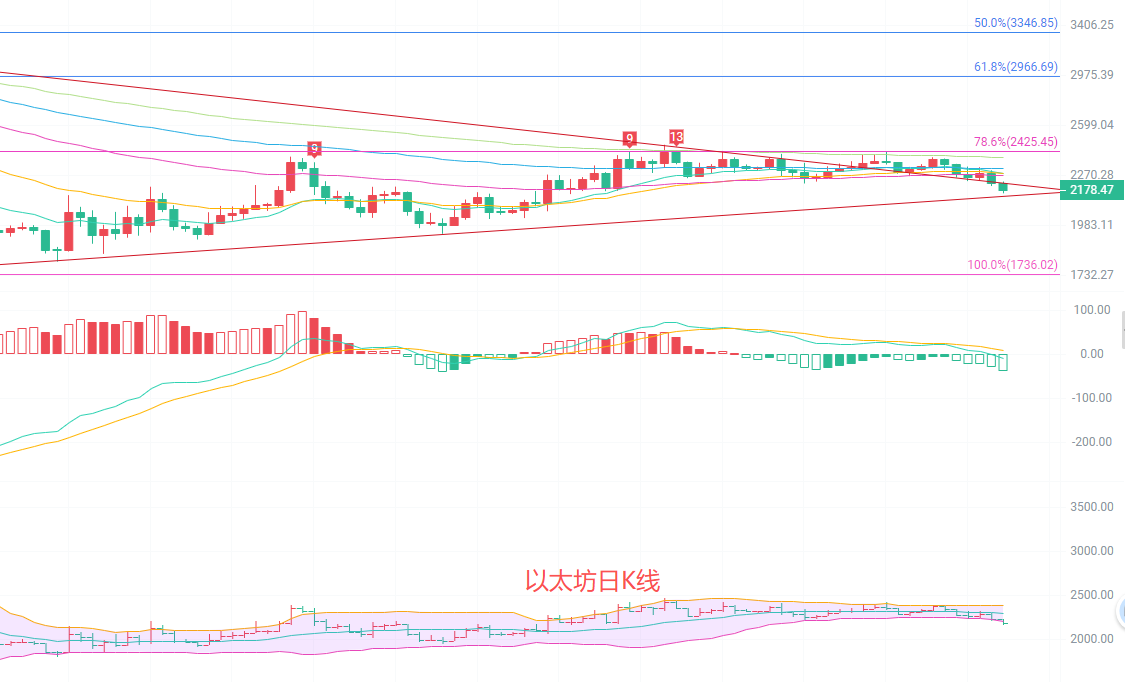
The daily K-line has formed a candlestick with a small lower shadow, and the price has broken below the EMA15, EMA30, and other short-term moving averages. The MACD indicator's red bars are continuously shortening, with momentum clearly weakening, and the middle Bollinger Band at 2296 is also forming strong resistance, indicating a weak overall trend. From previous price movements, the support around 2160 has been repeatedly tested, and once this position is broken, it is very likely to test the 2000 mark. Currently, the trading volume has not shown a significant increase, indicating that the north has no intention of counterattacking; the short-term market is dominated by the south.
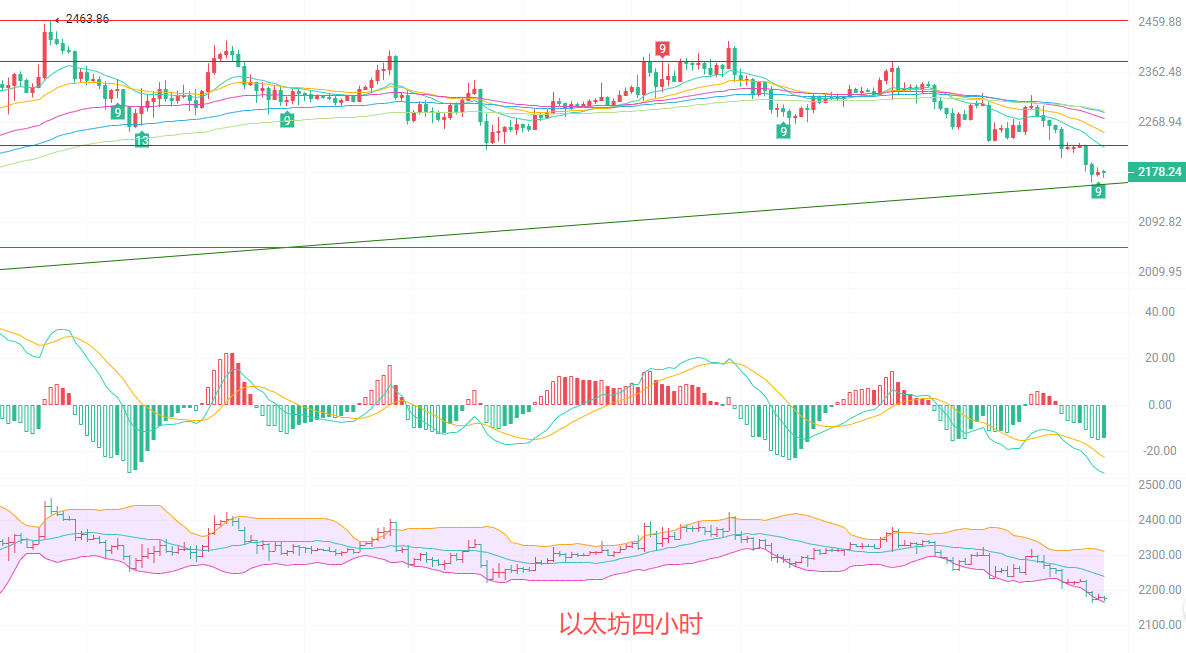
The four-hour K-line has clearly formed a downward channel, with the moving average system all aligned downward. The price continues to decline along the lower Bollinger Band, and the MACD indicator has entered the negative zone, with green bars continuously increasing, and downward momentum still being released. The current price is oscillating around 2176, with the upper pressure level in the range of 2220-2230, which is the previous oscillation platform and also the position of the EMA15 moving average. As long as the price does not re-establish itself above here, the downward trend will not change. Any short-term rebound is merely a weak counterattack and is unlikely to change the overall direction.
Short-term reference:
Short at 2200 to 2230, stop loss at 2250, target view of 2160 to 2100, if it breaks down, view 2080
Currently, I do not recommend blindly bottom fishing. Only when the price stabilizes above 2230 and does not break below 2200 on a pullback should one consider taking a light long position, with a stop loss set below 2160 and a target range of 2280-2300. Be sure to maintain a proper stop loss; the current market is highly volatile, and before the direction is established, do not take large positions.

Kind reminder: The above content is solely created by Weibo and public account: Chen's Army 166. The advertisements at the end of the article and in the comments section are unrelated to the author. Please be cautious in distinguishing them. Thank you for reading.
免责声明:本文章仅代表作者个人观点,不代表本平台的立场和观点。本文章仅供信息分享,不构成对任何人的任何投资建议。用户与作者之间的任何争议,与本平台无关。如网页中刊载的文章或图片涉及侵权,请提供相关的权利证明和身份证明发送邮件到support@aicoin.com,本平台相关工作人员将会进行核查。