Dear friends, I am Sister Qinglan. Before the market opening today, there is a significant piece of news that must be taken seriously: U.S. Treasury yields have surged, triggering a sell-off in risk assets, with Bitcoin directly pressured to fall below the $80,000 mark. At the same time, $441 million was liquidated across the entire network in 24 hours, with long positions suffering heavy losses, and Brother Maji closing long positions with losses of nearly $32 million. The combination of these events indicates that market sentiment has entered a state of panic, and short positions dominate in the short term. Against this backdrop, we need to let the data speak for us and not operate based on feelings. Today, Sister Qinglan’s cryptocurrency classroom will take you through an analysis of the current market using the TPV system to find a clear trading strategy.
Current Price and Time
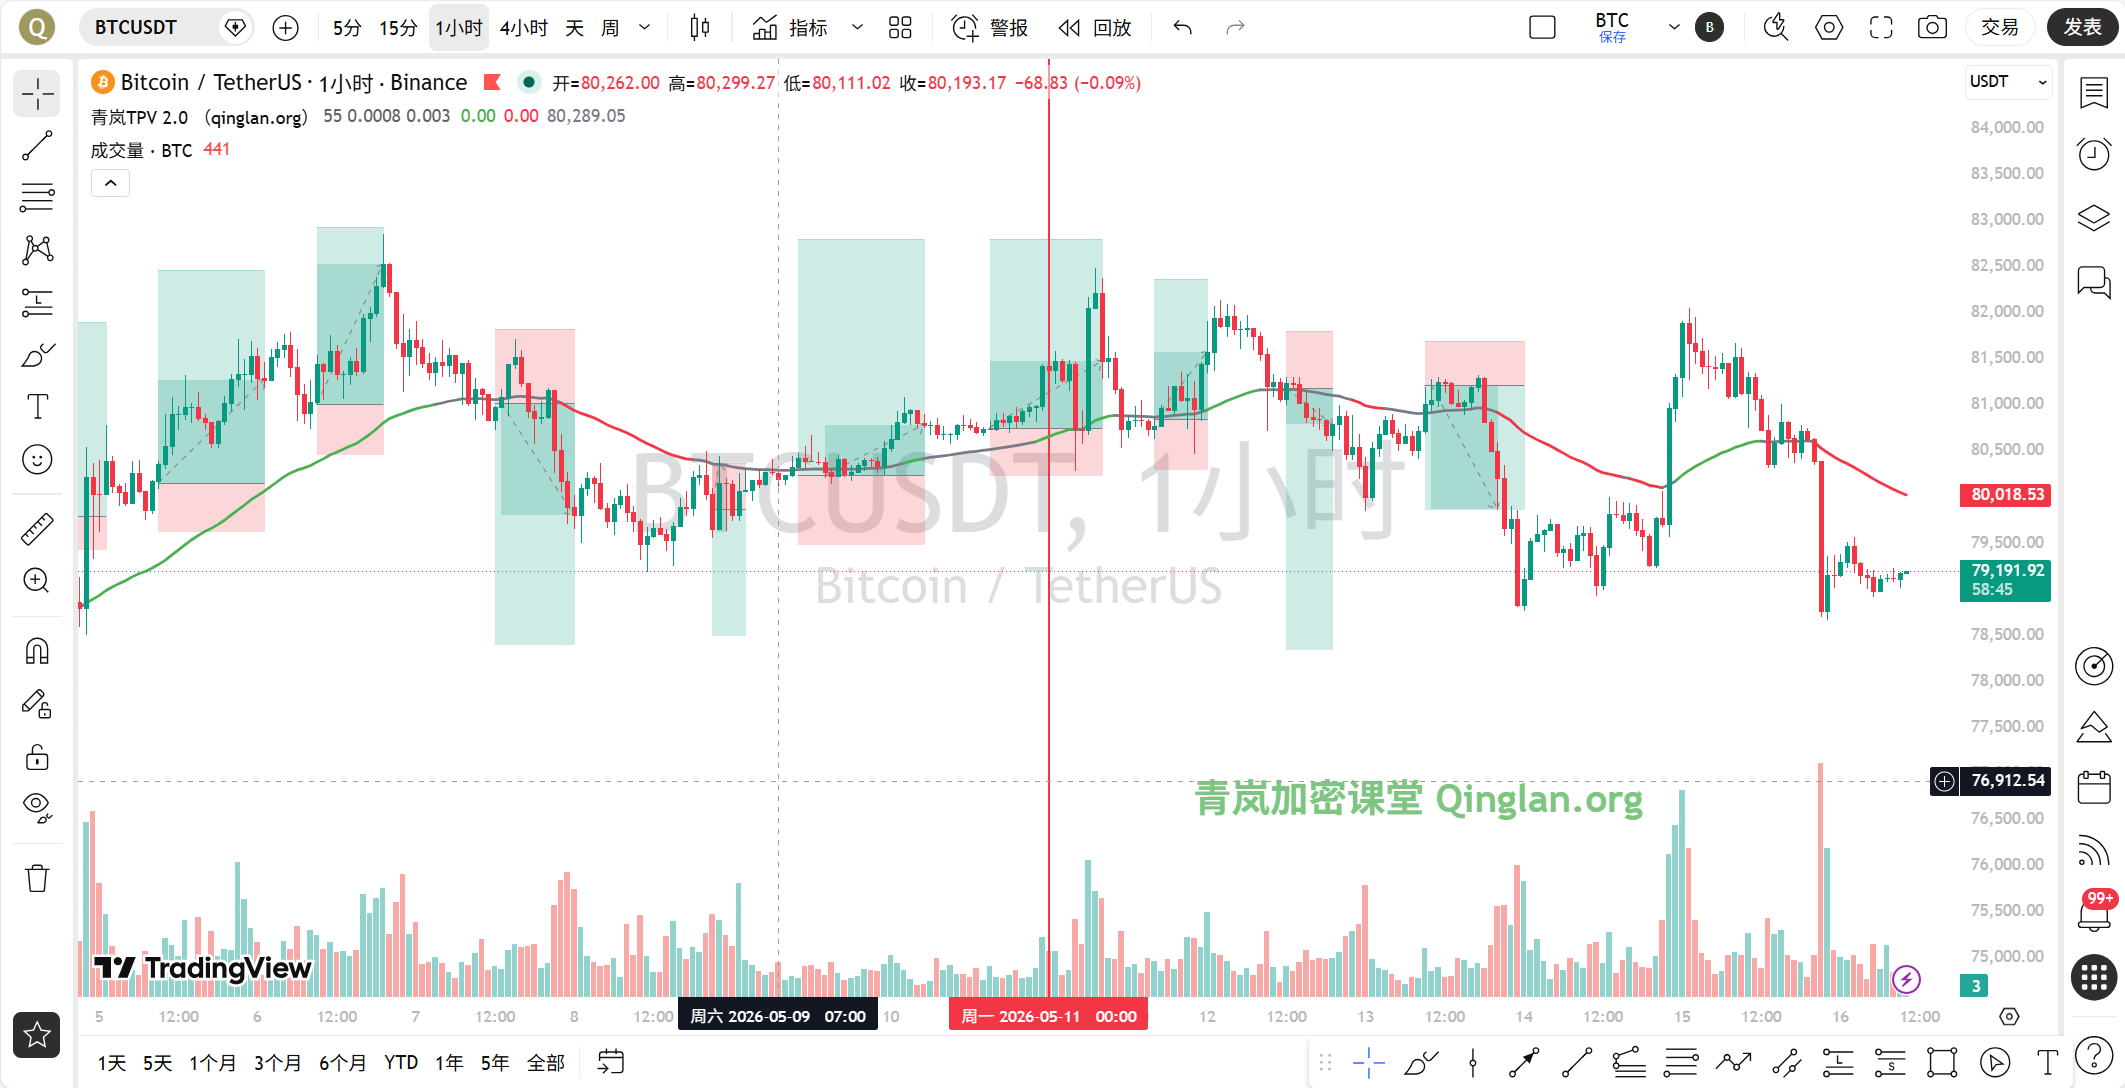
Current time is May 16, 10:00, Bitcoin's latest price is 79,184 USDT, down 2.44% in 24 hours. The Fear and Greed Index is 43, indicating a state of fear. At this position, many people may ask if this is a bottom-fishing opportunity, but Sister Qinglan wants to remind you that before the trend is clear, do not easily catch falling knives.
Multi-Timeframe Overview
First, looking at the daily level, MA5=79,841, MA10=80,403, MA30=78,549, the price is operating below MA5 and MA10, but still above MA30. The MACD histogram is -376.54, DIF=1,254.80, DEA=1,631.35. After DIF crossed below DEA, it continues to weaken, but the daily level is still in a bullish trend adjustment phase. RSI=51.86, indicating a neutral and slightly weak area, and there are no oversold signals.
On the 4-hour level, MA5=79,444, MA10=80,290, MA30=80,433, and the price has clearly fallen below all moving averages. The MACD histogram is -134.35, DIF=-305.41, DEA=-171.06, showing that bearish momentum continues to amplify. RSI=46.38, in a weak area, not yet oversold.
On the 1-hour level, MA5=79,136, MA10=79,167, MA30=80,077, with the price struggling below MA30. EMA55=80,011.32, the current price of 79,184 is far below EMA55, reaching a margin of 1.03%. The MACD histogram is -6.89, DIF=-377.13, DEA=-370.24, although bearish momentum has somewhat converged, DIF and DEA are still below the zero axis, indicating a bearish trend. RSI=30.17, nearing the oversold area but not confirming a reversal.
On the 15-minute level, MA5=79,111, MA10=79,130, MA30=79,124, the price is oscillating narrowly near the moving averages. The MACD histogram is 18.35, DIF=-35.77, DEA=-54.13, with signs of a golden cross appearing, but the strength is very weak. RSI=56.33, in a neutral area.
In summary, the daily level is in a bullish adjustment phase, but the 4-hour and 1-hour levels have clearly turned bearish, and the 15-minute level shows a short-term rebound demand but with insufficient strength. The overall structure presents a pattern of major cycle support and minor cycle pressure.
TPV Signal Validation
According to the Qinglan TPV system, we take the 1-hour EMA55 as the boundary between long and short. The current price of 79,184 is far below the EMA55 of 80,011.32, and in the past 8 one-hour candlesticks, the closing price has been greater than EMA55 0 times, crossing EMA55 0 times, indicating that the bearish trend is very clear, not meeting oscillation conditions, and is in a one-sided downward state.
Short-selling condition validation: Firstly, the price is under pressure below the 1-hour EMA55, with 2 consecutive one-hour candlesticks closing below EMA55, which has already been met. Secondly, resistance is encountered, as seen from the 4-hour level, where the price has faced resistance in the 80,000-80,400 area, resulting in effective high points. Thirdly, the rebound is weak; although the 1-hour MACD histogram has shrunk for 2 consecutive periods, DIF and DEA are still below the zero axis, and RSI has risen from around 30 but with limited strength and no strong reversal signals like bullish engulfing. Therefore, all short-selling conditions are satisfied, and the current bearish trend is valid.
Long condition validation: Firstly, the price needs to stabilize above the 1-hour EMA55, which is currently far from being satisfied. Secondly, support must stabilize; although RSI is close to oversold, there are no significant long lower shadows or bottom formations on the daily and 4-hour levels. Thirdly, bearish momentum must exhaust; although the MACD histogram has shortened, the extent is very small, and RSI has not risen from below 30. Therefore, the long conditions are not established, and bottom fishing is not recommended.
On-chain/Fundamental Analysis
Regarding on-chain data, the Fear and Greed Index is 43, in the fear zone, indicating a pessimistic market sentiment, but historically the fear zone often represents a mid-term bottom area, which needs to be judged in conjunction with technical analysis. BTC's market share is 58.24%, maintaining a high level, indicating that capital is still seeking refuge in Bitcoin, but short-term selling pressure comes from the macro level. On the news front, the surging U.S. Treasury yields and rising interest rate expectations are the main bearish factors, and the net inflow of 1,761 BTC from ETFs provides some support but with limited strength. Overall, the funding situation is bearish, making it difficult to establish an effective rebound in the short term.
Key Attack and Defense Levels
The current key resistance levels are at the 1-hour EMA55 of 80,011 and the 4-hour MA10 of 80,290. If the price rebounds to these levels, it will face strong pressure. The support levels below are at the daily MA30 of 78,549 and around the prior low of 78,000. If it falls below 78,000, it may accelerate the decline to the 76,000-77,000 area. The short-term long and short dividing line is at the 80,000 mark; only above 80,000 can the bearish pressure be alleviated.
Trading Strategy
Direction: Bearish, short on rebounds, do not chase shorts.
Entry Conditions: Wait for the price to rebound to the 79,800-80,000 area, look for a long upper shadow or top formation on the 1-hour level, and ensure the MACD histogram expands again, with RSI falling back from around 30, confirming rebound weakness before entering short. If the price directly breaks below 78,000, a light short can be initiated, but strict stop-loss is required.
Stop-loss Level: Set above 80,500; if the price breaks through the 1-hour EMA55 and stabilizes, the bearish logic becomes invalid.
Target Level: First target 78,500, second target 77,000, third target 76,000.
If the price shows a 1-hour bottom formation near 78,500, and the MACD histogram has shortened for 2 consecutive periods, RSI rises from below 30, a light long position can be considered, but it must be entered and exited quickly, with a stop-loss set below 78,000, aiming for 79,500-80,000.
Risk Reminder
The current market is dominated by macro bearish factors, with increased volatility; any trading must have stop-loss set, and do not hold on to losing trades.
Follow Sister Qinglan's cryptocurrency classroom for more trading opportunities! Welcome to visit the official website www.qinglan.org
📊 Qinglan TPV Trading Strategy Backtest Reference
🕒 Last Backtest Time 05-16 07:00:01
Total Analysis: 1554 Backtest: 1549 Accuracy: 66.4% (1029/1549)
免责声明:本文章仅代表作者个人观点,不代表本平台的立场和观点。本文章仅供信息分享,不构成对任何人的任何投资建议。用户与作者之间的任何争议,与本平台无关。如网页中刊载的文章或图片涉及侵权,请提供相关的权利证明和身份证明发送邮件到support@aicoin.com,本平台相关工作人员将会进行核查。