This article is merely a personal market opinion and does not constitute investment advice. Any gains or losses incurred from operations based on this are the sole responsibility of the individual.
In the early hours of today, BTC has already broken down below 79,000, which is the horizontal line support position in the chart below. This is the high point of the rebound from early February and the resistance level from April 23 to May 4. Since April, the rebound and the new highs at the beginning of this month have seen a decrease in the price increment of BTC, a typical divergence signal for upward movement.
At the same time, BTC has also broken below the rising trend line since March 30. The upward trend has been destroyed, and the next question is when will it start to decline?
After breaking below 79,000 last night, there was a wave of increased volume, indicating that there is still considerable buying strength below 79,000. Therefore, for the bulls, the best case scenario might be a continued fluctuation around 79,000, and trying to see if it can stand back above the trend line. If it falls below 78,000, then the bulls are basically without hope.
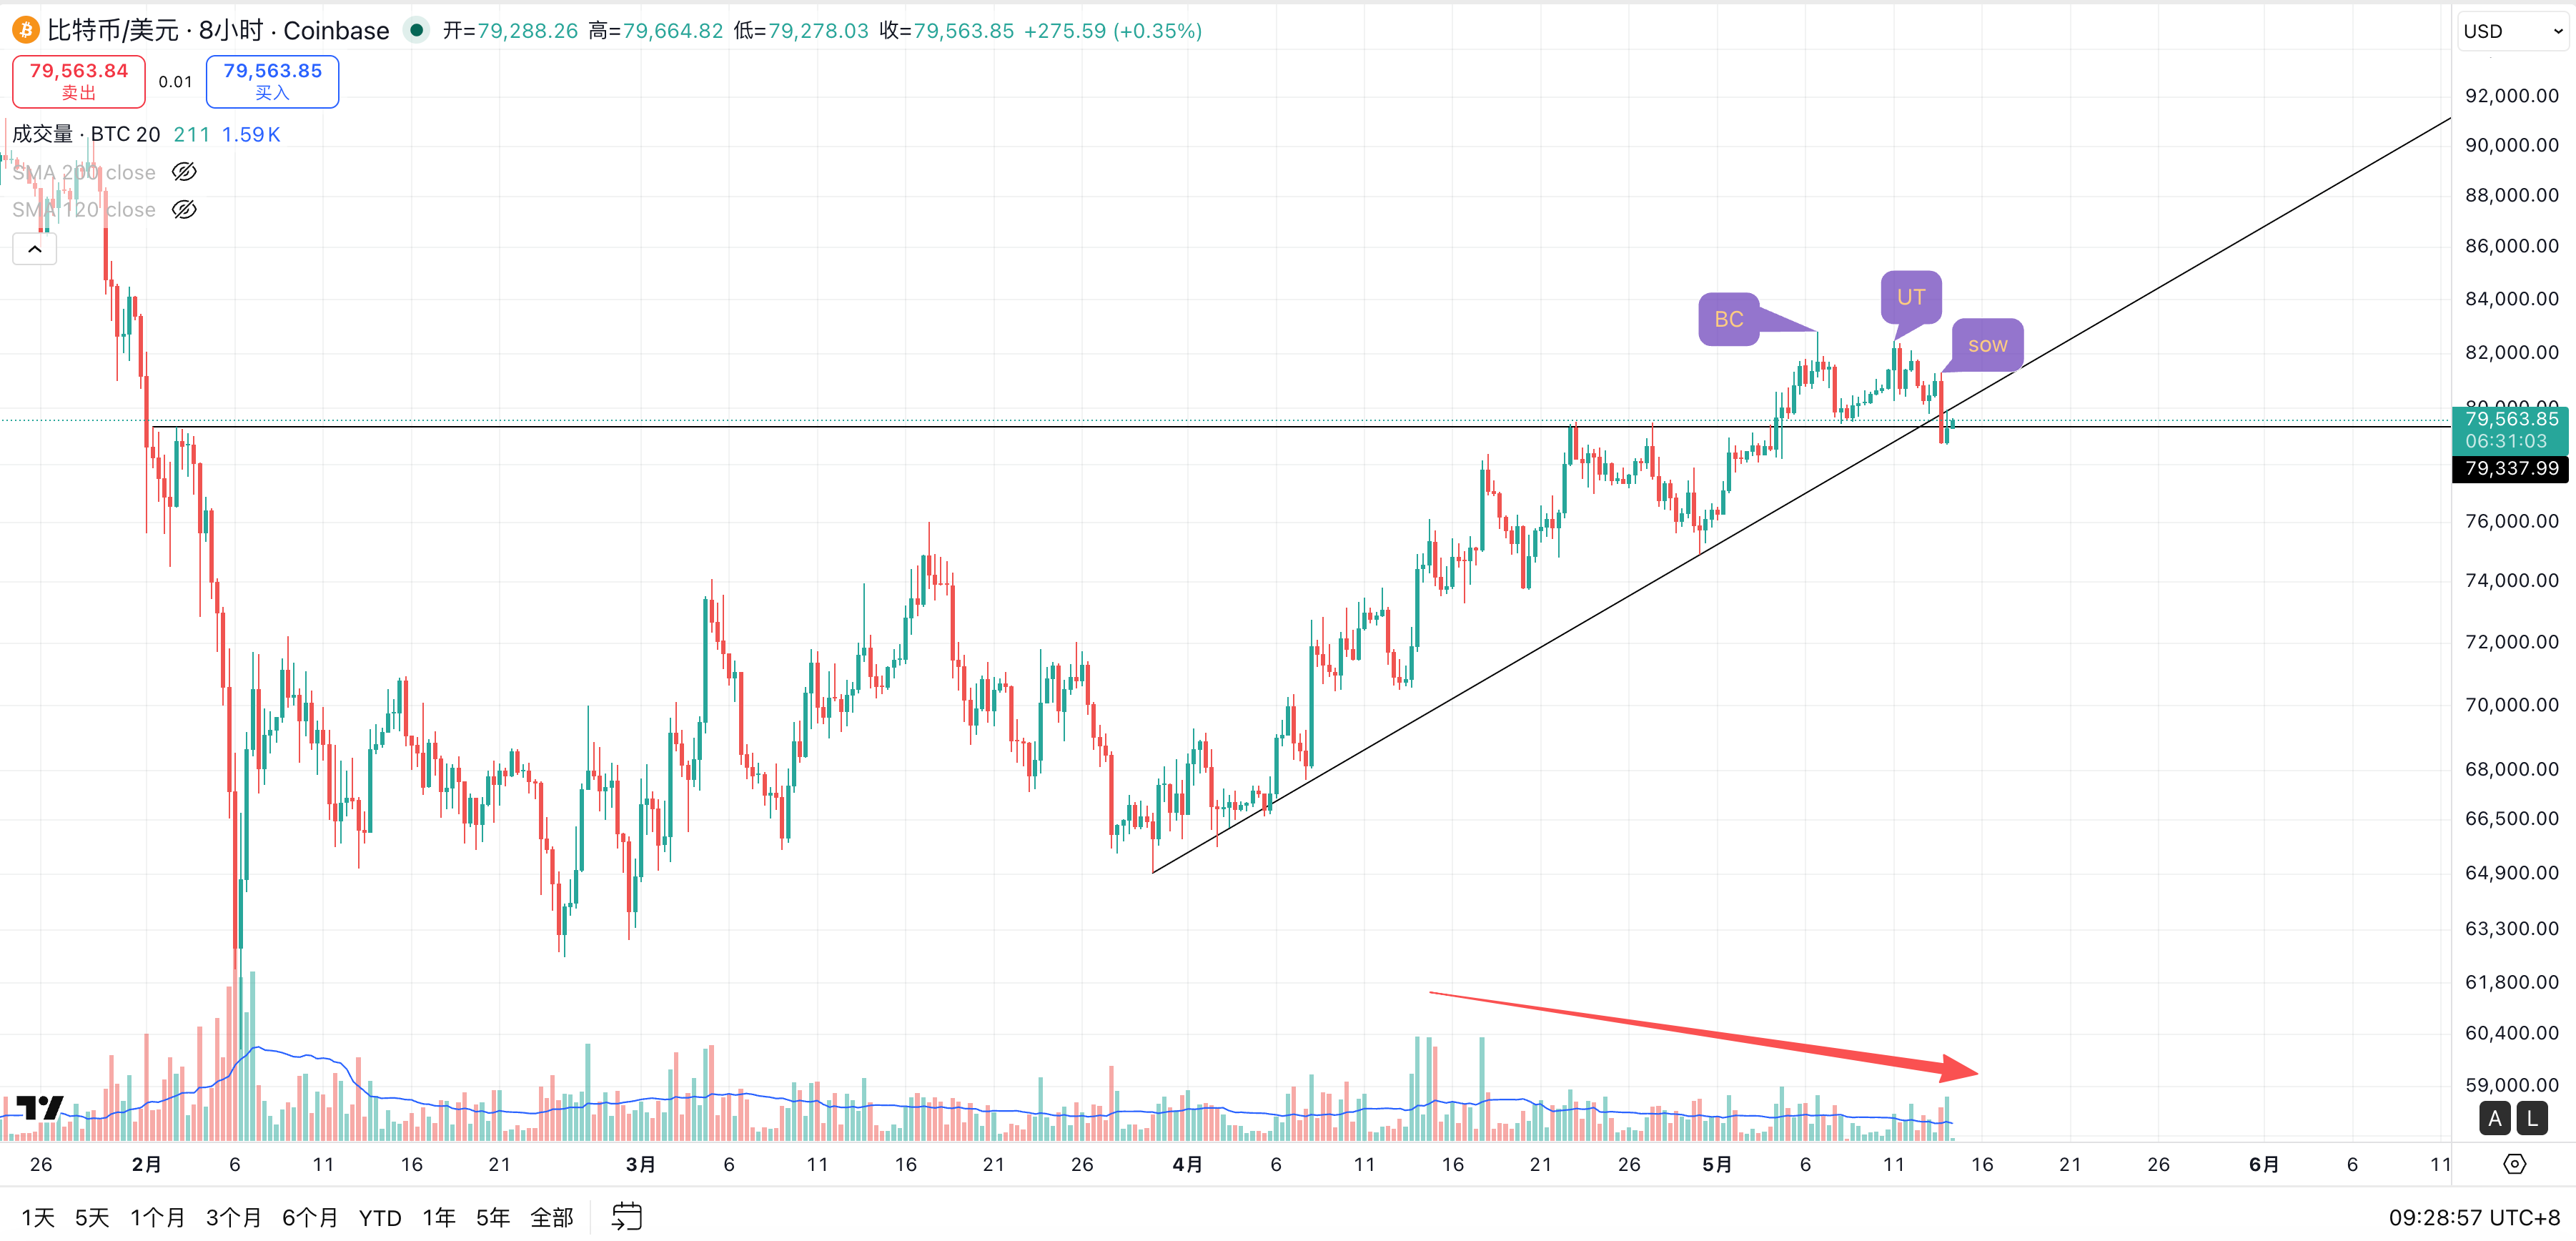
From a Wyckoff structure perspective, the 8-hour level volume shadow line on May 6 represents a typical buying climax (BC), and the 8-hour volume candlestick at 0:00 on May 11 is a second test of the top (UT) that failed to set a new high. The 8-hour level candlestick at 16:00 yesterday afternoon is a sign of SOW, indicating weakness. Normally, the rebound should not exceed the high of this candlestick — 81,300.
In summary, the time left for BTC bulls is running out. At most, there will be some more fluctuations, and if there is a rebound, there might only be one opportunity. It is estimated that within a week, a new downward trend is about to arrive.
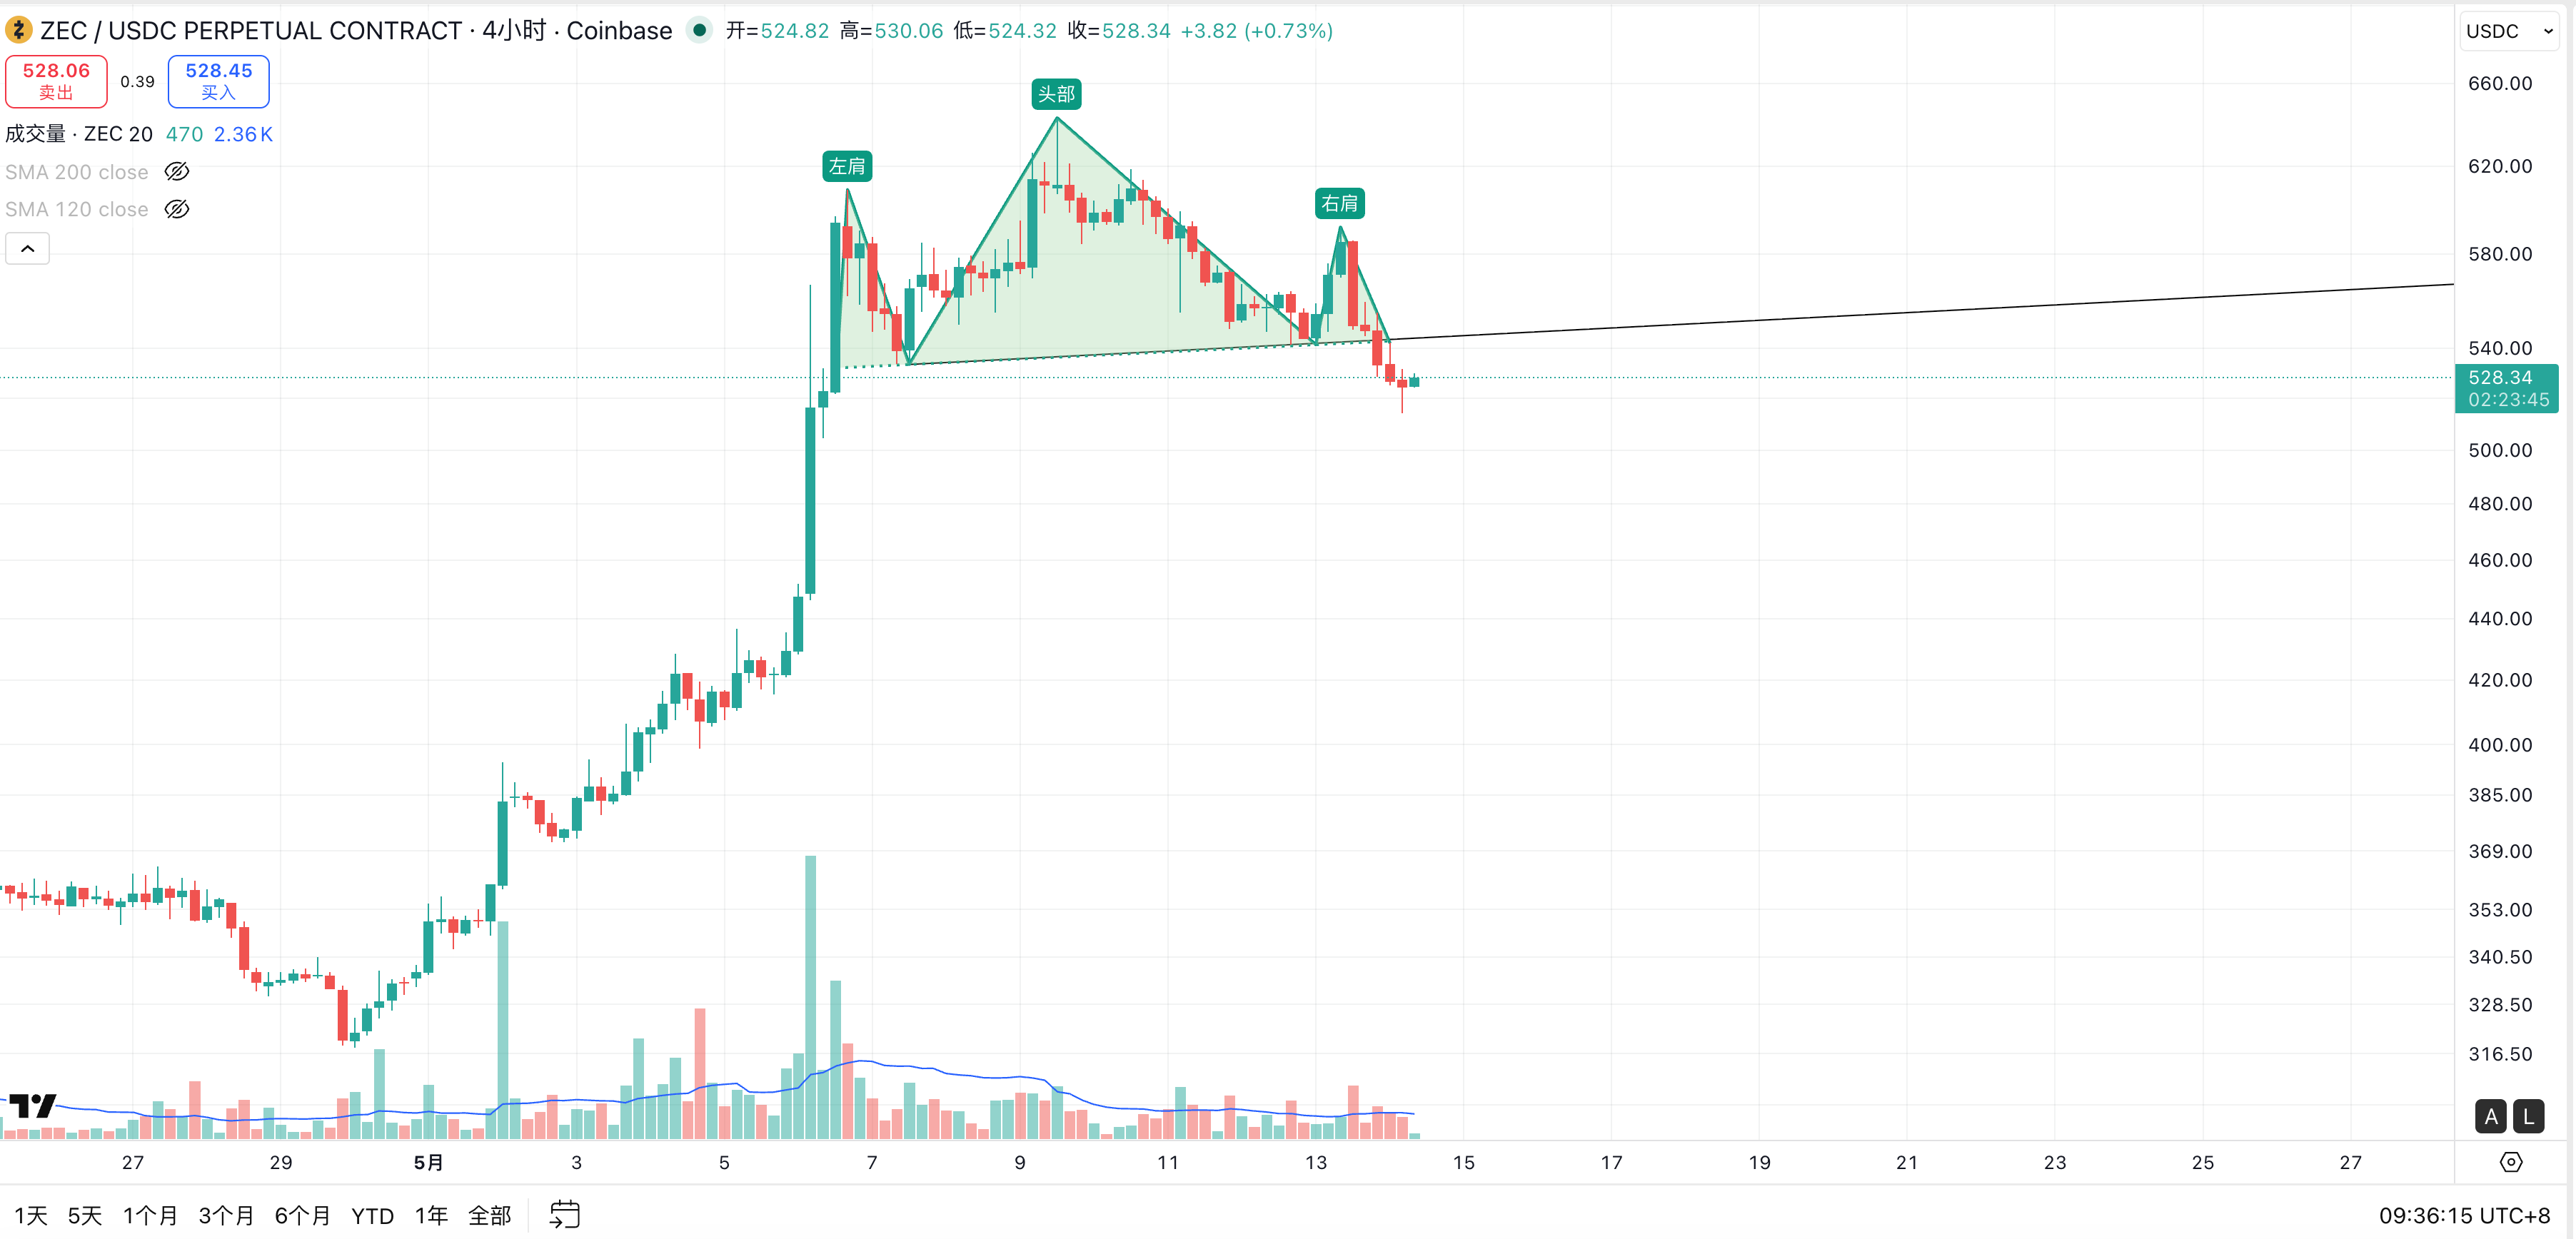
Additionally, there is a relatively good shorting target that has just broken below the shoulder top neck line, which has a small stop loss and a large profit potential, making it an extremely high cost-performance variety — ZEC. Even if the judgment is wrong, the stop-loss space is minimal.
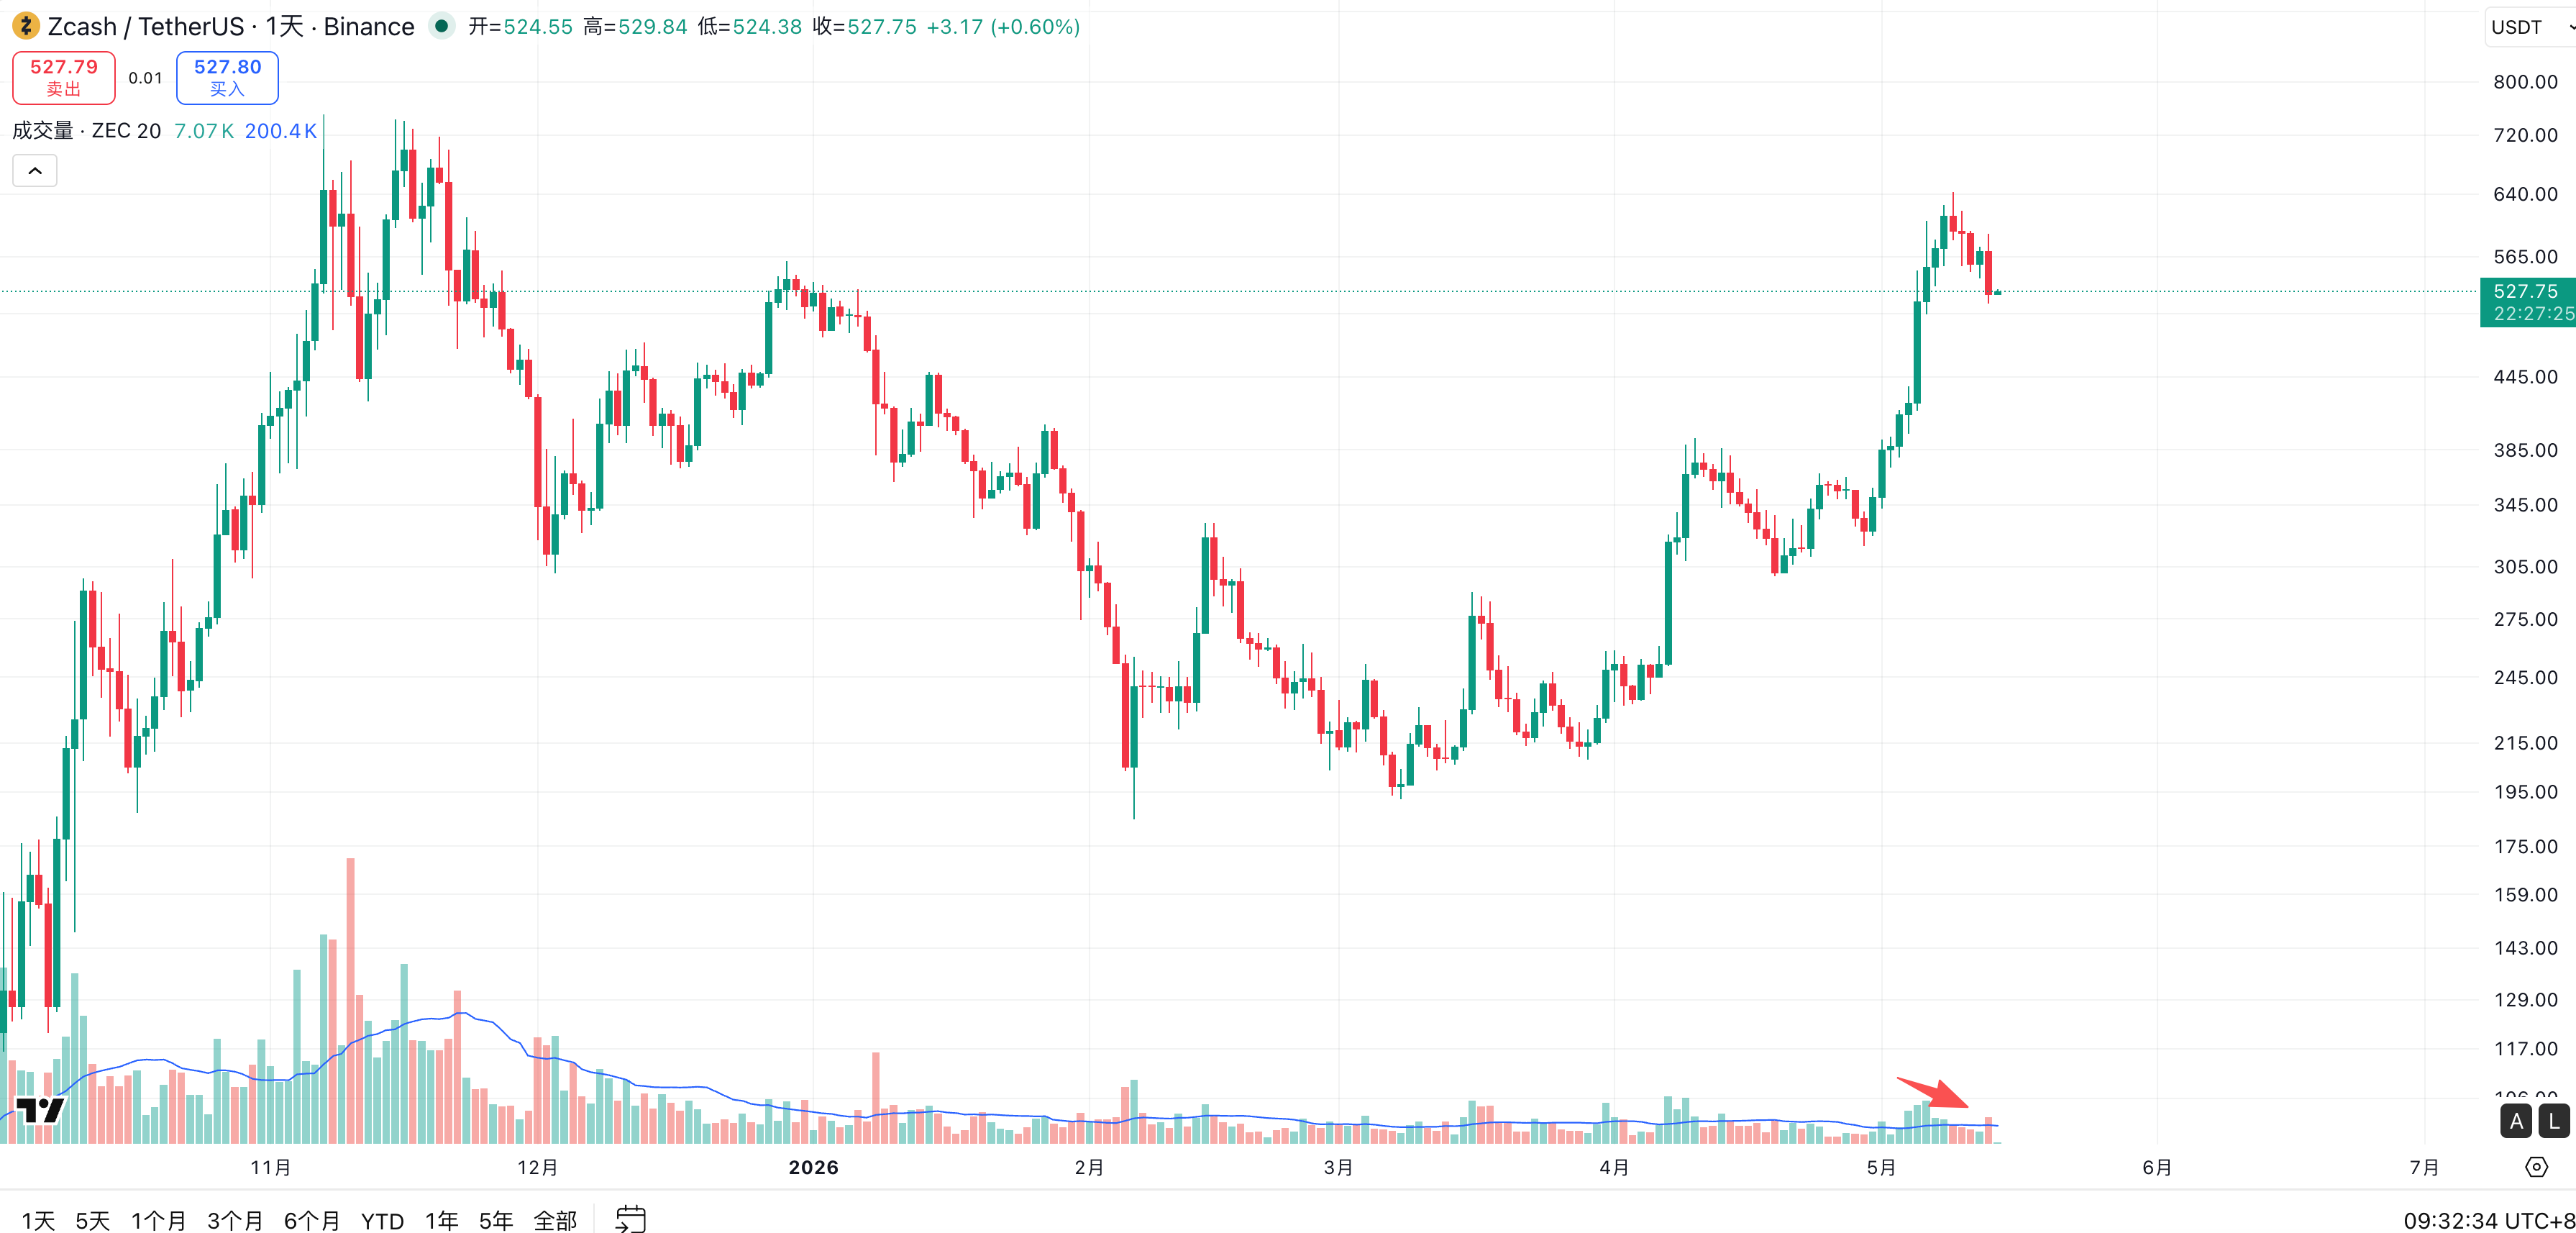
From a long-term perspective, ZEC has recently had a massive rebound, nearing the top from the end of last year. However, the trading volume has continued to decrease during the last few days of the rising process and formed a long bearish candlestick with increased volume yesterday. The recent largest trading volume on May 6, accompanied by a long upper shadow, corresponds to the buying climax. The first shrinking bearish candlestick on May 9 indicates that the buying demand is weak, and a little selling pressure is enough to push the price down. Yesterday's long bearish candlestick is a sign of SOW, indicating weakness.
Moreover, from the 4-hour level in the chart below, the shoulder-top formation has been broken down. The trading volume has decreased stepwise from the left shoulder to the top to the right shoulder, meeting the pattern requirements. Combined with the daily candlesticks, it is likely to return to the previous low below 190.
Follow me to maximize trend profits with minimal operations.

免责声明:本文章仅代表作者个人观点,不代表本平台的立场和观点。本文章仅供信息分享,不构成对任何人的任何投资建议。用户与作者之间的任何争议,与本平台无关。如网页中刊载的文章或图片涉及侵权,请提供相关的权利证明和身份证明发送邮件到support@aicoin.com,本平台相关工作人员将会进行核查。


