Crypto Circle Academician: On May 14, Ethereum 2253 remains weakly volatile, the structure does not change, as long as key support is not broken, the rebound market may start at any time! Latest market analysis and operational suggestions
Ethereum current price 2255, tested upward twice and was swept away; this wave of market is indeed frustrating, difficult to rise and not deeply falling, back and forth stopping losses makes it the most exhausting market. Everyone should not get too caught up in trading, make sure to keep positions light, especially at times like this when the direction is unclear, don’t go all in and use up all your bullets. Remember, being alive is more important than anything else, and it’s not too late to increase positions after the trend becomes clear. If there’s no volume breakout at night, it’s highly likely to still be volatile; don’t let small short-term fluctuations affect your mindset, let’s remain steady, there will be plenty of opportunities!
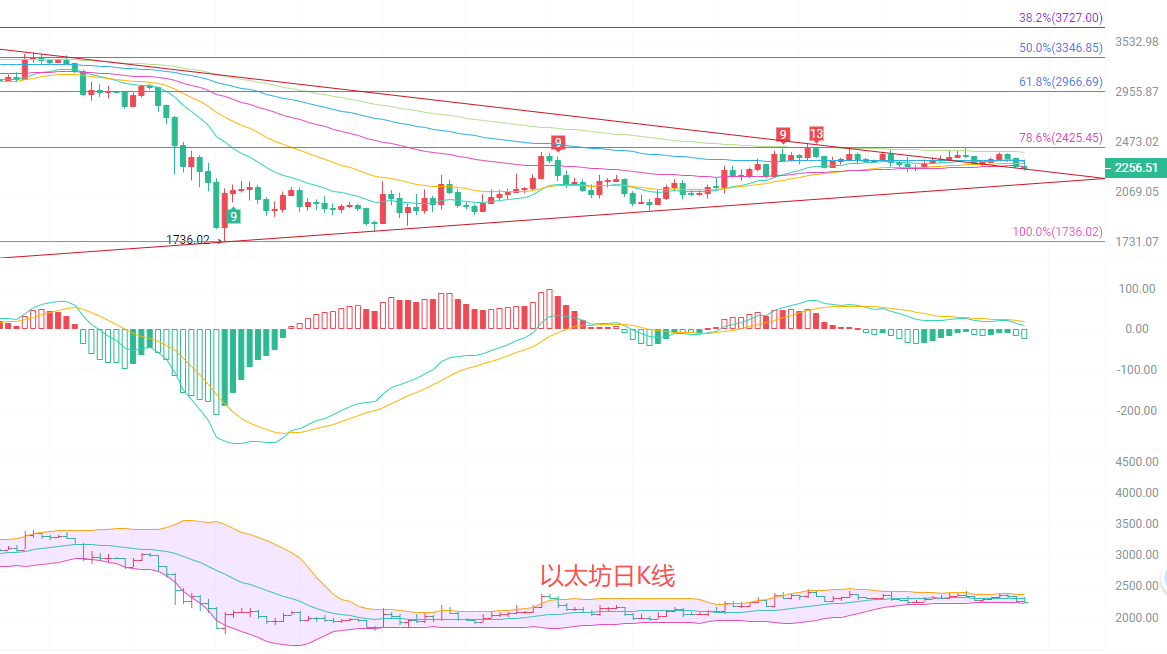
The daily K-line is still in a weak volatile pattern. The price is running below the EMA30, and the short-term moving averages are turning down, showing that the upward counterattack is weak. Although the MACD has not produced a golden cross signal, the green bars continue to shorten, indicating that the downward momentum is gradually weakening, and a technical rebound is possible. The Bollinger Bands are narrowing, with the upper and lower bands at 2383 and 2240 respectively, indicating that the price range is being compressed, suggesting that the market is accumulating strength and is about to break out in a direction.
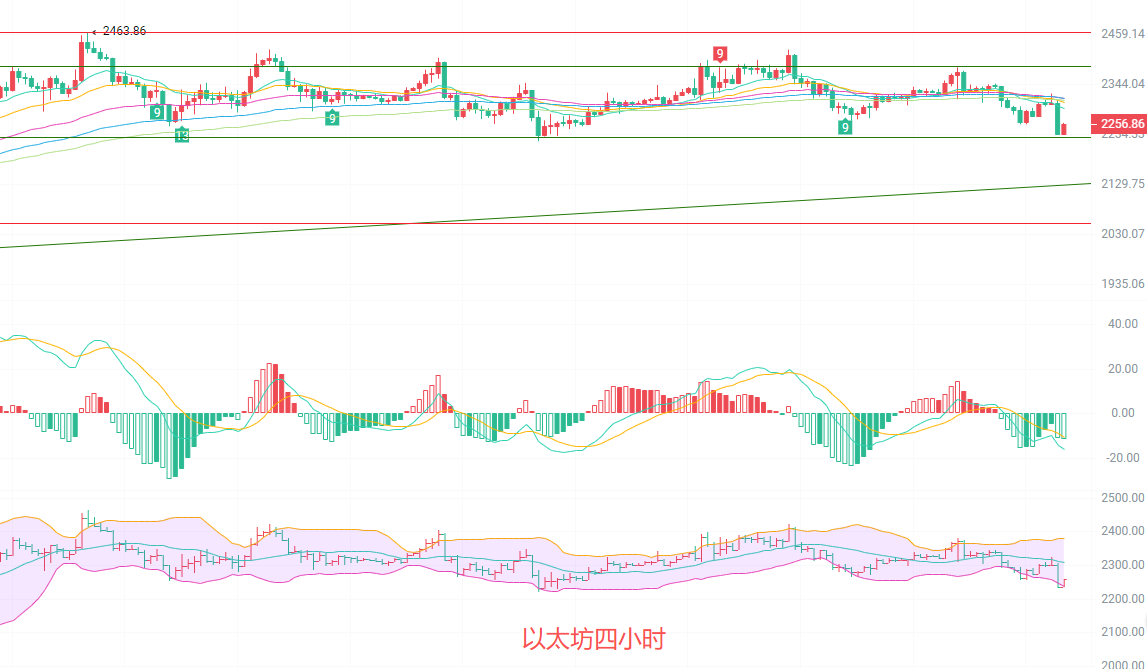
The four-hour K-line has just completed a wave of downward breaks, with the price falling below the previous consolidation platform, and the MACD death cross has led to a continuous expansion of green bars, indicating a clear downward trend in the short term. The moving average system shows a typical downward arrangement, with EMA15, EMA30, and EMA60 layer on layer suppressing the price, which has repeatedly faced resistance at the 2300 mark. The Bollinger Bands are opening downwards, with the price closely following the lower band, currently in an oversold state; a slight rebound is likely to repair the indicators, but the rebound height is limited, making it difficult to break through the 2300 resistance level.
Short-term reference:
Buying from 2240 to 2210, stop loss at 2180, target watching 2280 to 2300
Selling from 2290 to 2310, stop loss at 2340, target watching 2260 to 2240
Specific operations should be based on real-time data from the market; for more detailed information, you can consult the author. The publication of this article is delayed, and the suggestions are for reference only; risks are borne by yourself.

Warm reminder: The above content is only created by the author on Weibo; the ads at the end of the article and in the comments section are not related to the author, please be cautious in identification, thank you for reading.
免责声明:本文章仅代表作者个人观点,不代表本平台的立场和观点。本文章仅供信息分享,不构成对任何人的任何投资建议。用户与作者之间的任何争议,与本平台无关。如网页中刊载的文章或图片涉及侵权,请提供相关的权利证明和身份证明发送邮件到support@aicoin.com,本平台相关工作人员将会进行核查。