Crypto Circle Academician: Bitcoin fell to 79088 on May 14! A thorough analysis of the daily and four-hour structure, the critical points for bulls and bears have been locked in! Latest market analysis and trading advice
The current price of Bitcoin is 79150, and Bitcoin is playing a heartbeat game of jumping up and down. It just touched the high point of 82828 and then turned around to crash, directly burying many friends who chased the price at the peak. I am not surprised at this pullback at all; the high position has been sideways for too long, and there was already a need for adjustment. I was also liquidated after opening a long at 80500, but this does not mean the bull market has ended; this is just a shakeout! Now the price is repeatedly grinding around 79000, some are shouting to buy the dip while others are shouting waterfall, but the market is never gambled based on emotions. I only look at indicators to speak, not engaging in mysticism. Today I will break down the key signals of the daily and four-hour charts for you, and after reading it, you will know how to operate without being led by the market.
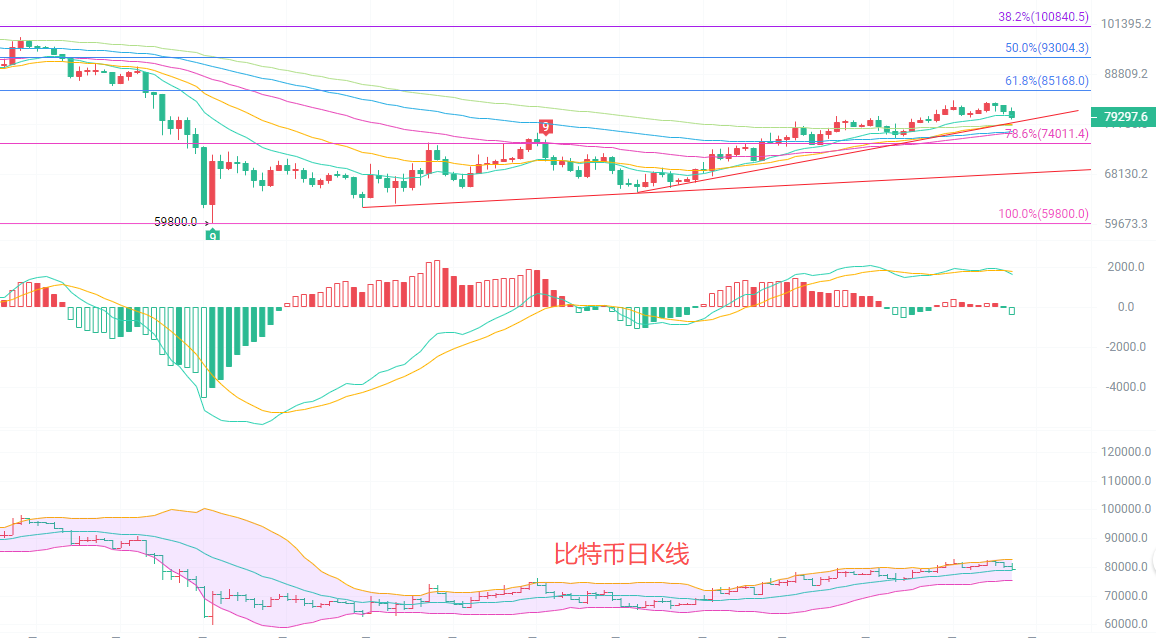
From the daily candlestick chart, yesterday closed with a bearish candlestick with a decline of 1.71%, ending the previous days' consecutive small upward movements. The price is still operating above EMA30 at 77847, and the moving averages still have not been completely disrupted. However, the MACD indicator's red bars are continuously shortening, and the DIF has started to turn down, indicating that the upward momentum is weakening. The midline of the Bollinger Bands at 79045 was briefly lost, with the lower track at 75360 forming critical support, and the upper track at 82731 creating strong resistance. Overall, the daily level is in a high-level consolidation phase after an increase, with intensified divergence between bulls and bears, and short-term caution is needed for the risk of retracing to the moving average support.
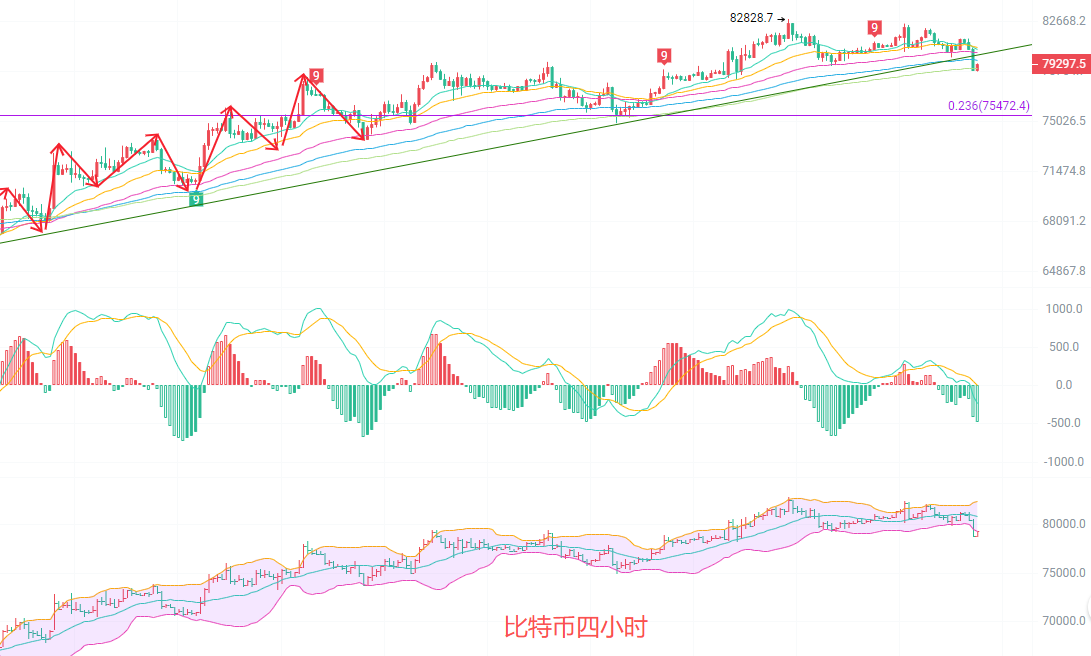
The four-hour candlestick showed a large bearish candlestick that directly broke through the EMA15 at 80422 and EMA30 at 80561, with short-term moving averages turning downward, forming an initial signal for a southward arrangement. The MACD indicator's green bars have significantly expanded, and the DIF has fallen below the DEA forming a death cross, indicating that downward momentum is being continuously released. The Bollinger Bands are opening downward, the price has fallen below the midline at 80861, and is approaching the lower track at 79264. Currently, the lower track's support has not been completely broken, but the KDJ indicator has entered the oversold range, indicating that there may be a need for a small rebound for correction in the short term. Overall, the four-hour level is in a correction trend, with strong resistance above from the moving averages, and operations should focus on defense.
Short-term trading ideas reference: Follow the trend of the larger cycle, with small stop losses for quick entries and exits
For the downside from 78000 to 78500, set a stop loss at 77500, with a target of 78900 to 80500
For the upside from 80500 to 81000, set a stop loss at 81500, with a target of 79000 to 79300
Specific operations should be based on real-time market data. For more information, you can consult the author. There may be a delay in article publication, and suggestions are for reference only, with risks taken at your own expense.

Kind reminder: The above content is created solely by the author on Weibo. The advertisements at the end of the article and in the comments section are unrelated to the author. Please discern cautiously, and thank you for reading.
免责声明:本文章仅代表作者个人观点,不代表本平台的立场和观点。本文章仅供信息分享,不构成对任何人的任何投资建议。用户与作者之间的任何争议,与本平台无关。如网页中刊载的文章或图片涉及侵权,请提供相关的权利证明和身份证明发送邮件到support@aicoin.com,本平台相关工作人员将会进行核查。