Coin Waves: 5.13 Ethereum (ETH) Market Analysis Reference:
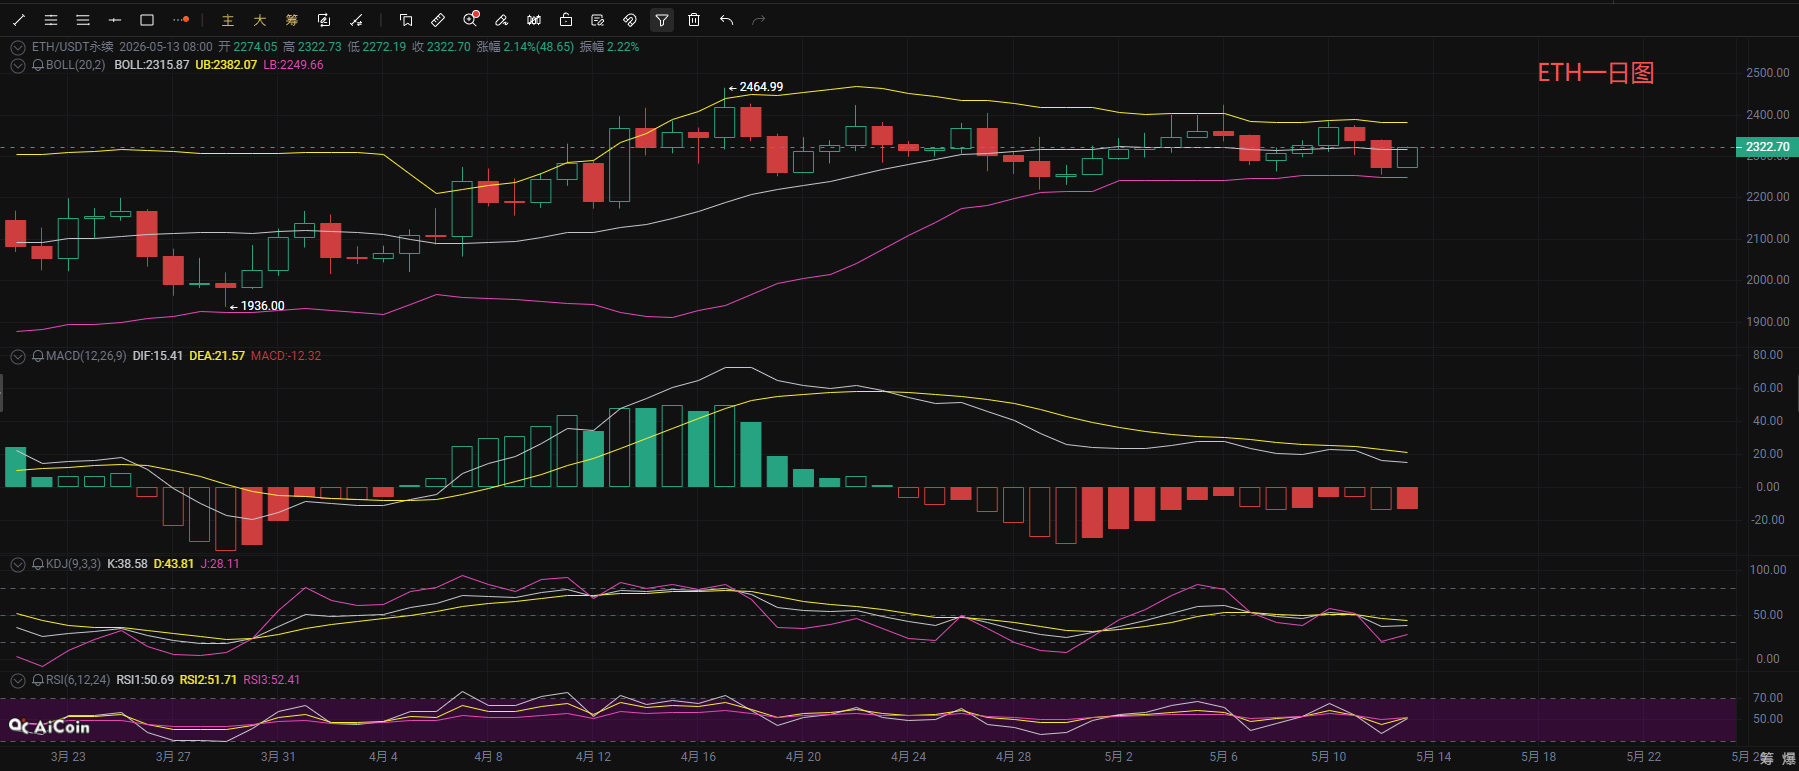
The Ethereum intraday market has shown a rebound for recovery, currently in a consolidation phase at the daily level. The current price has just surpassed the middle band of the Bollinger Bands, but is still under pressure from the upper band, with support from the lower band. The MACD indicator's DIF is still operating below DEA, with the red bars slightly shortened. The bullish momentum is weak but there is no clear reversal signal; the KDJ three lines have turned upward below 50, with the J line showing a noticeable rebound, indicating a slight increase in short-term rebound momentum; the RSI indicator is in a neutral zone, with no signs of overbought/oversold. Today's candle is a small bullish line, overall showing a pattern of weak consolidation recovery, but without forming a clear trend. Only by holding the 2330-2350 range with increased volume can we confirm a bullish continuation signal at the daily level.
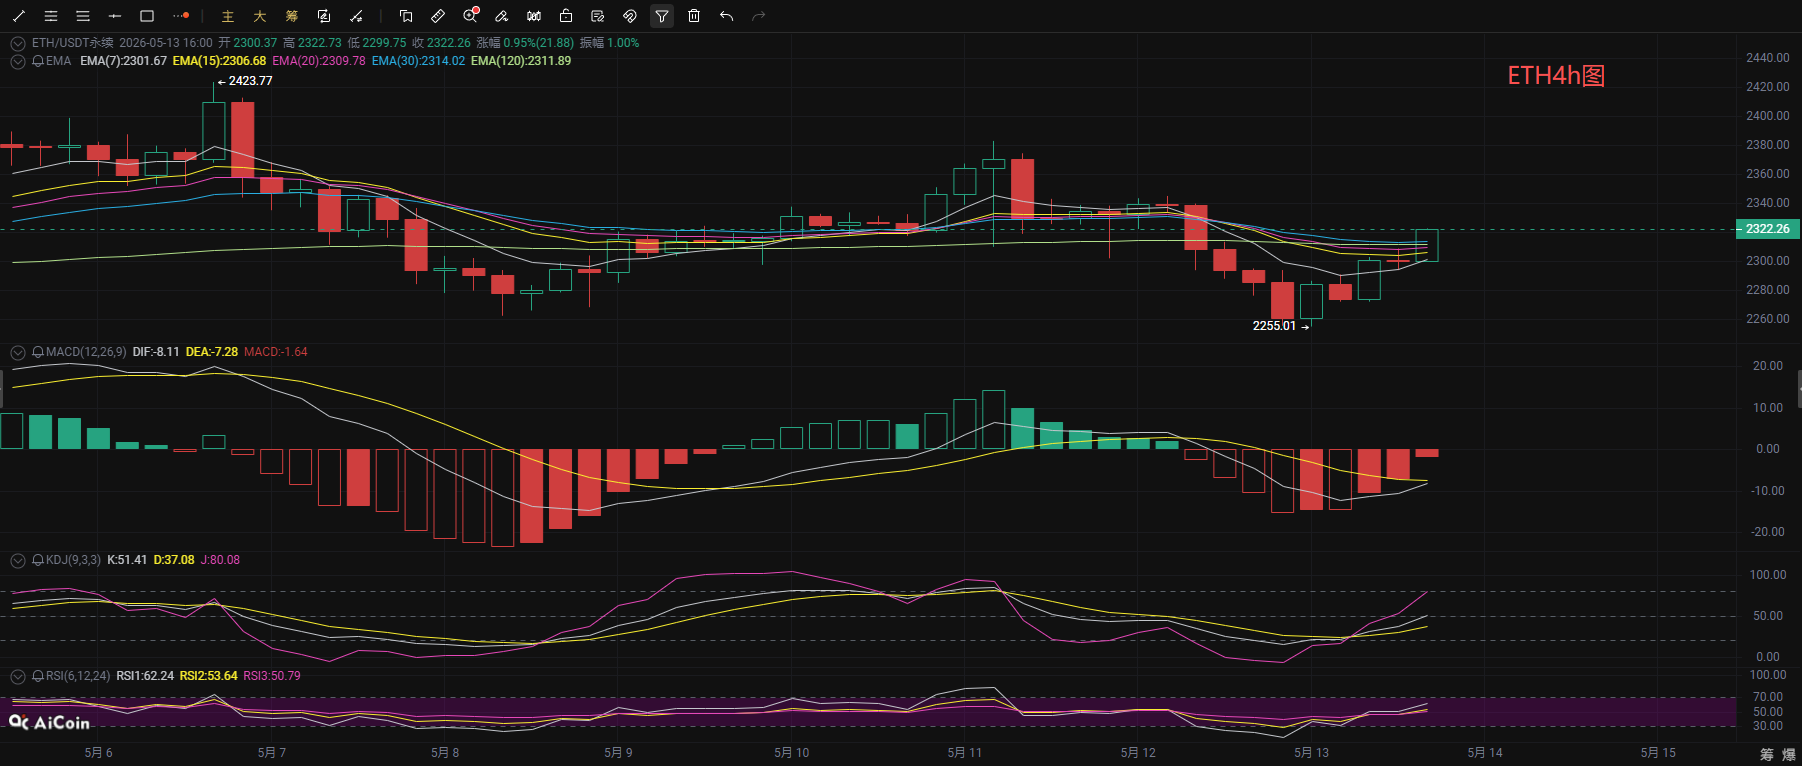
The short-term 4-hour level is currently in the recovery rebound phase after a decline, with the current price breaking through the EMA moving average group and standing above the middle band of the Bollinger Bands, under pressure from the upper band. The Bollinger Bands are narrowing, indicating a short-term strong consolidation. The MACD histogram continues to decrease, with DIF approaching DEA, showing a significant reduction in bearish momentum; the KDJ indicator has formed a golden cross and is diverging upward, with the J line making a rapid ascent. The RSI indicator has risen to a neutral upper zone, alongside the EMA short-term moving average turning upward. Short-term rebound momentum is enhanced, but pressure is concentrated in the upper 2330-2350 range. If the price fails to break through the upper band of the Bollinger Bands with increased volume, it is likely to return to a consolidating trend. In terms of strategy, it is not recommended to blindly chase highs; maintain a high-sell low-buy strategy within the range, and only follow the trend after a breakout.
Coin Waves: 5.13 Ethereum Short-term Reference:
Short Position: 2370-2340 range short, stop loss 30 points, target look at 2320-2270,
Long Position: 2250-2280 range long, stop loss 30 points, target look at 2300-2340,
【The above analysis and strategies are for reference only. Please bear the risk yourself. The article publication may have delays, and strategies may not be timely. Please do not operate blindly】

The content of this article is shared by 【Coin Waves】, representing only personal views. There may be delays in article sending, for reference only, please do not operate blindly! Want to get more daily real-time signals? Then follow my public account! Here, you can engage in online technical learning as well as understand knowledge about exiting investment positions. I have years of research experience in the market, focusing on the major trends in the cryptocurrency sector. I am mainly responsible for analyzing and guiding investments in BTC, ETH, SOL, BCH, and other cryptocurrencies. Welcome to study and research together.
免责声明:本文章仅代表作者个人观点,不代表本平台的立场和观点。本文章仅供信息分享,不构成对任何人的任何投资建议。用户与作者之间的任何争议,与本平台无关。如网页中刊载的文章或图片涉及侵权,请提供相关的权利证明和身份证明发送邮件到support@aicoin.com,本平台相关工作人员将会进行核查。