Choosing the right timeframe in trading is often more important than studying a hundred indicators. Many people tend to look at 15-minute, 30-minute, or one-hour charts, but the 15-minute timeframe has too much noise, and false signals appear frequently. The one-hour timeframe reacts too slowly, making it easy to miss the best opportunities. The 45-minute timeframe fits perfectly in between; it is a non-standard period that is very suitable for short and swing trading. It can filter out most ineffective fluctuations and false breakouts while avoiding traps set by the main forces in the commonly used default periods, allowing us to see a more authentic market structure.

Using the 45-minute timeframe to find buy and sell points, my most commonly used combination is EMA lines + MACD. For the moving averages, I prefer EMA24 and EMA52; this parameter set provides stable signals and is highly referenceable. The moving averages are used to judge trends, where a golden cross represents the opening of a bullish trend, and a death cross confirms a bearish trend. If the 24 line crosses above the 52 line forming a golden cross, it signals an upward move. Conversely, it signals a downward move when the situation is reversed. Simply looking at golden and death crosses may lead to lagging signals; a more reliable method is to observe pullbacks. If price pulls back to the EMA52 line without breaking below it, or briefly breaks below and quickly recovers, it is a high-quality entry point for going long. Conversely, if the price retraces to the moving average and fails to break through, it is a reliable short signal.
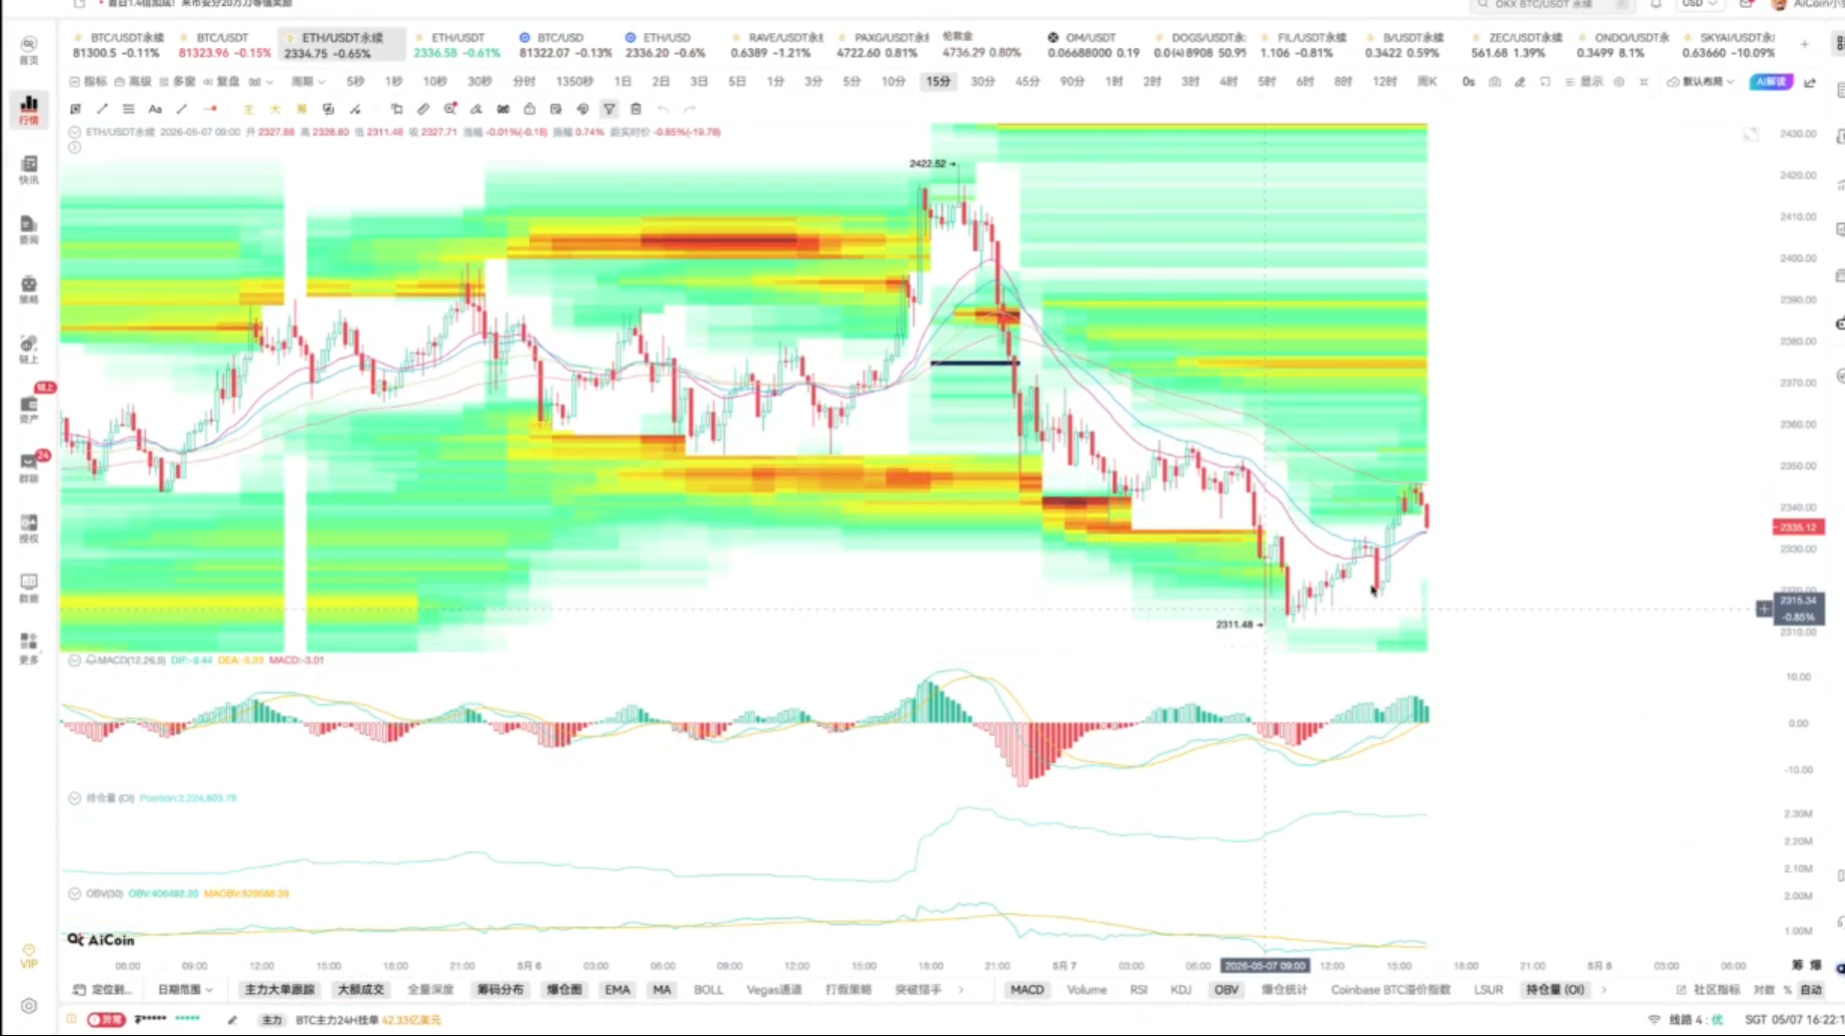
I maintain the default MACD parameters of 12, 26, and 9, primarily to observe momentum and divergence. I seldom look only at golden crosses and death crosses. In a bullish trend, that is, when EMA24 stays above EMA52, I focus on observing divergence signals. Divergence can be categorized as momentum divergence and line divergence. Momentum divergence is observed through volume bars; when the price continuously reaches new highs but the corresponding MACD volume bar does not rise correspondingly, it signals a top divergence. If the price reaches a new low and the volume bars do not decrease in sync, it indicates a bottom divergence. Line divergence looks at the DIF fast line; if the price hits a new high but the DIF line does not follow up, it indicates a line top divergence. If the price hits a new low and the DIF line does not decline accordingly, it depicts a line bottom divergence. An important premise for judging divergence is that the compared high and low points must always be on the same side of the zero axis; only such divergence signals are valid.
In practice, the accuracy of line divergence tends to be higher than that of volume bar divergence. If one looks solely at momentum divergence, it is easy to get trapped. Combining line divergence tends to be more reliable. When line top divergence coincides with a top formation, meaning among three K lines, the middle one has both the highest and lowest points as the highest, this becomes a very high probability short entry point, more precise than the entry point from a dual moving average death cross. Additionally, insufficient momentum is also a very critical signal; if price highs progressively decline and the corresponding volume also weakens, it indicates that the upward momentum is exhausted, suggesting a high probability of trend reversal. The MACD fast and slow lines will also cross down through the zero axis, providing a clear short signal. 
There is also a strong structure within the 45-minute timeframe that is very worthwhile to grasp. After the MACD fast and slow lines generate a death cross and pull back to the zero axis for adjustment, if the price consistently stays well above EMA24 or EMA52, it indicates that the support below is very strong, representing a strong consolidation. When the MACD generates a golden cross again above the zero axis, it often signals the beginning of a new rising wave, providing a safe opportunity for entry or to increase positions. This structure performs particularly stably with mainstream and popular currencies. 
There is also an easily overlooked invisible divergence which also holds high reference value. When the price reaches a new high while the corresponding MACD volume bar shows a bearish volume, indicating that bullish momentum has not been released, it is an invisible top divergence, representing a strong short signal. If the price reaches a new low but corresponds to a bullish volume bar, it is an invisible bottom divergence, indicating a clear long signal. If invisible divergence, line divergence, and top formations occur simultaneously, the win rate will further increase.
This set of trading methods using the 45-minute timeframe is applicable to mainstream currencies, popular currency categories, and even traditional markets such as London gold and U.S. stocks. It is not recommended for low-cap currencies that are severely controlled, as even the most effective indicators struggle against highly controlled trends. I do not recommend setting profit targets and stop losses purely based on fixed ratios; instead, use the peak of chip positions, large order liquidity, and key moving average positions to determine, which will align more closely with the real market's support and resistance.
Try using the 45-minute non-standard timeframe more often; you will discover many real signals that are concealed in the default timeframes. Do not be overly distracted by too many indicators. Stick to the logic of EMA + MACD + divergence + formations, and consistently execute this in stable currencies to continuously capture high-quality buy and sell points.
This article only represents the author's personal views and does not represent the platform's stance or views. This article is for informational sharing only and does not constitute any investment advice to anyone.
免责声明:本文章仅代表作者个人观点,不代表本平台的立场和观点。本文章仅供信息分享,不构成对任何人的任何投资建议。用户与作者之间的任何争议,与本平台无关。如网页中刊载的文章或图片涉及侵权,请提供相关的权利证明和身份证明发送邮件到support@aicoin.com,本平台相关工作人员将会进行核查。