Dear friends, I am Sister Qinglan. This morning, as I opened the market, the first thing I saw was two major news stories clashing. On one side, the April inflation in the United States surged, with the CPI hitting a new high, Bitcoin falling below the $80,000 mark, and US stocks declining, leading to heightened risk aversion. On the other side, CryptoQuant's Bitcoin bull-bear indicator turned green, suggesting that the market may be entering an early bull market. This intertwined situation of bullish and bearish sentiments is precisely when we need to analyze calmly. Data doesn't lie, so today we will use the Qinglan TPV system to clarify the current rhythm of BTC.
Current Price and Time
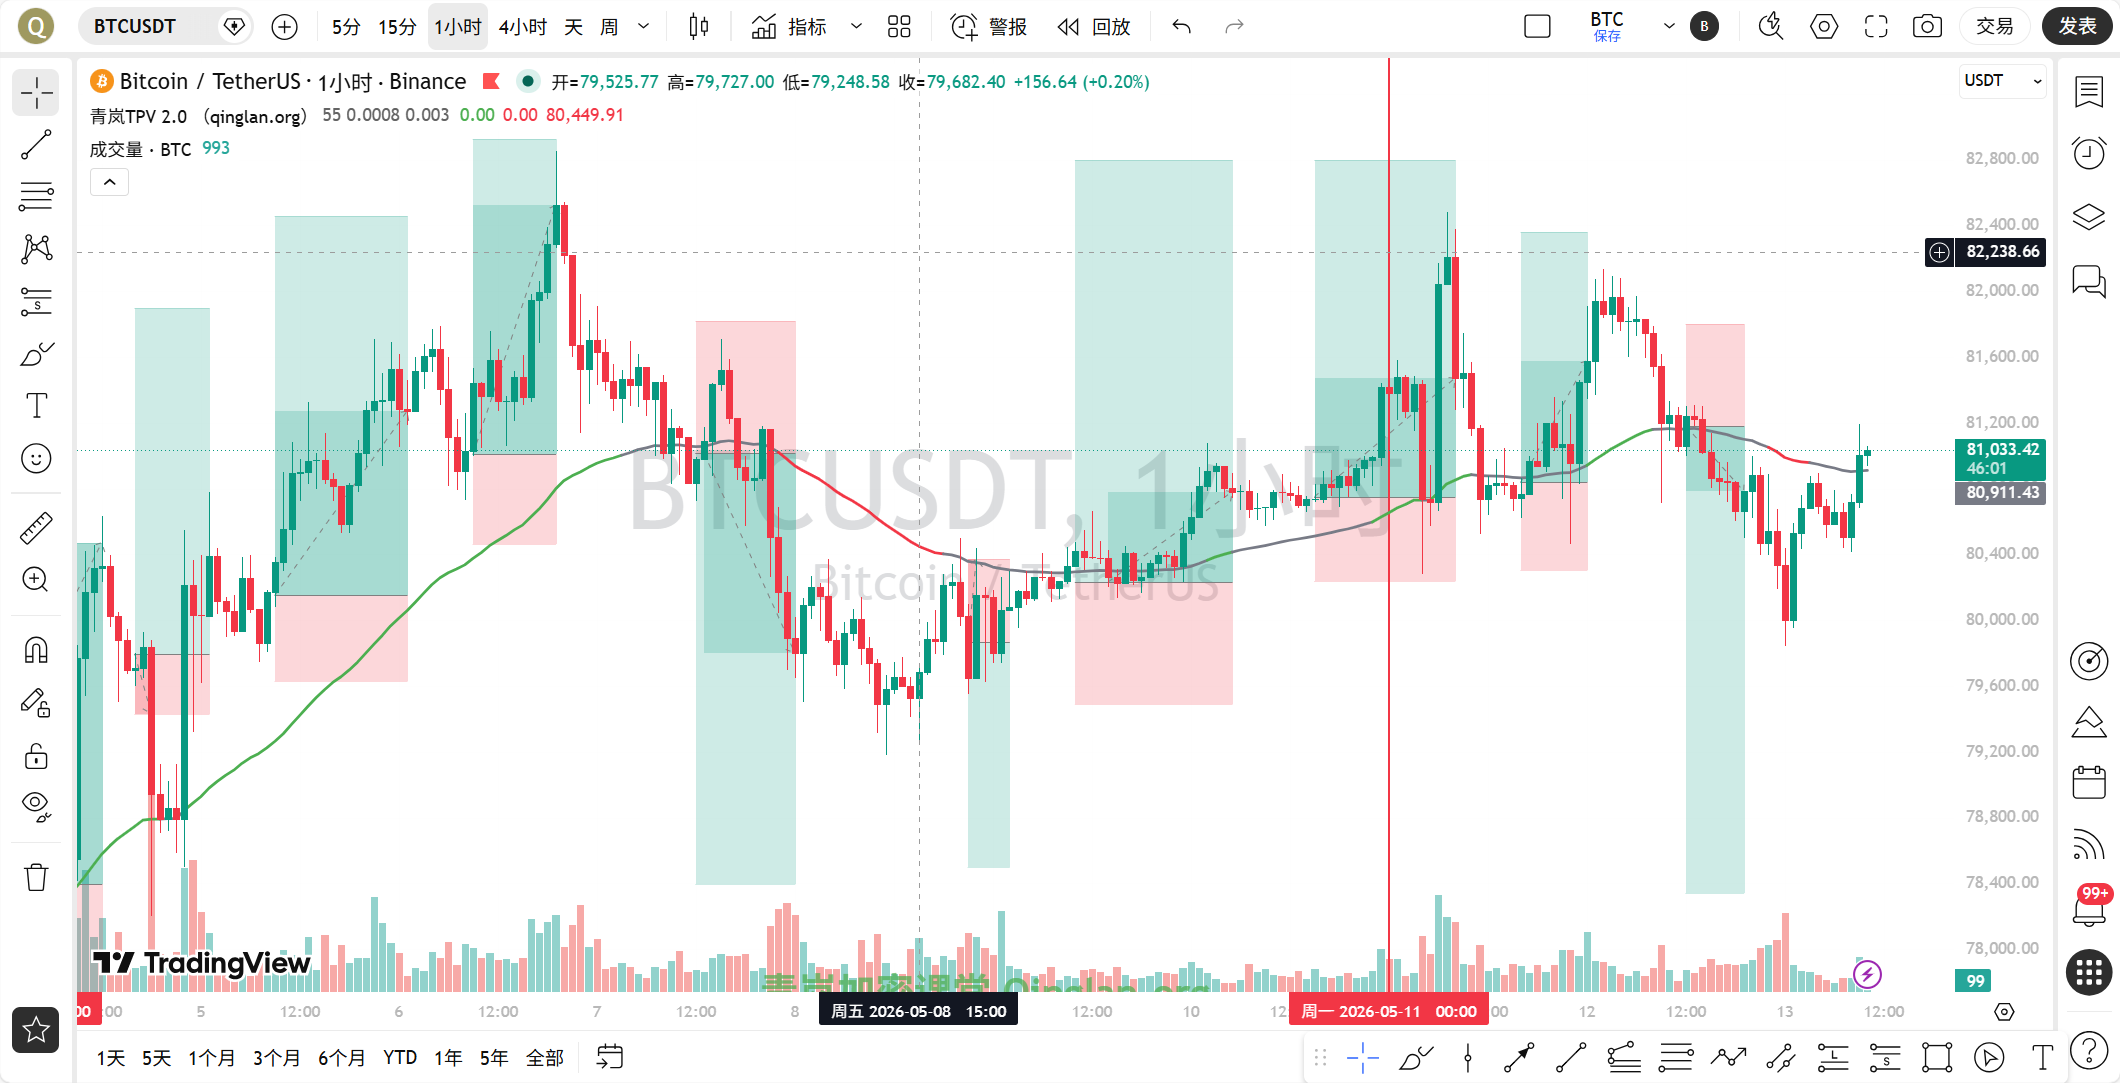
The current time is May 13th, 10:09 AM, with the latest quote for BTC at 81,040 USDT. The price has dropped by 1.52% over the past 24 hours, oscillating repeatedly near the $80,000 mark. This position is crucial; it is neither at a high nor a low, but rather in a sensitive range where both bulls and bears are testing each other.
Multi-Timeframe State Overview
First, let’s look at the daily chart. The MA5 is at 81,235, MA10 at 80,859, and MA30 at 78,097. The moving averages are still in bullish formation overall, but MA5 has already turned downward. The MACD's DIF is at 1,813.96, DEA at 1,880.14, with a histogram of -66.19, indicating a continuing death cross. The RSI is at 72.31; although it has dipped from the overbought zone, it remains in the relatively strong area. Overall, the daily chart leans towards bullish, but momentum is obviously weakening.
On the 4-hour level, MA5 is at 80,700, MA10 at 81,057, and MA30 at 80,806, with short-term moving averages tangled. The MACD's DIF is at 55.24, DEA at 146.57, and the histogram is at -91.33, falling in a death cross state. The RSI is at 46.92, in a neutral and relatively weak position. The 4-hour chart shows a weak oscillating pattern without a clear direction.
At the 1-hour level, MA5 is at 80,784, MA10 at 80,725, and MA30 at 80,913. The MACD's DIF is at -71.39, DEA at -140.22, with the histogram at 68.83, in a golden cross state. The RSI is at 52.77, neutral. The 1-hour EMA55 is at 80,942.96, and the current price of 81,040 is just barely above EMA55.
At the 15-minute level, MA5 is at 81,035, MA10 at 80,825, and MA30 at 80,731. The MACD's DIF is at 103.52, DEA at 54.51, with the histogram at 49.01, indicating a golden cross state. The RSI is at 66.78, relatively strong. The 15-minute chart shows short-term rebound momentum.
TPV Signal Verification
Now we enter the core segment of Sister Qinglan's crypto class, using the TPV system for signal verification.
First, let’s analyze the trend positioning. The current price is 81,040, and the 1-hour EMA55 is at 80,942.96. The price is above EMA55, indicating a bullish trend area. However, note that this margin is only 0.12%, indicating an extremely close fluctuation near the boundary.
Next, let's look at the auxiliary data for oscillation judgment. In the last 8 one-hour candlesticks, the closing price was greater than EMA55 only 2 times, with a crossover only once. According to TPV rules, a closing price above EMA55 must occur 3 to 5 times and the crossover at least 2 times to qualify as an oscillation, but here the count is insufficient, so it does not qualify as a standard oscillating market. However, the price's distance from EMA55 is less than 0.3%, which belongs to close line fluctuations, thus the probability of oscillation is increasing.
Now let's verify the buy conditions. First, the price needs to stabilize above EMA55. The current price is 81,040, while EMA55 is at 80,942.96, but consecutive 2 one-hour candlesticks must close above EMA55. Data shows that out of the past 8 candlesticks, only 2 closed above EMA55, indicating a lack of consecutive stabilization. Second, support must stabilize. The 15-minute level shows a rebound, but the 1-hour level lacks any significant long lower shadow or bottom formation. Third, the downward momentum should be exhausted. The 1-hour MACD histogram is positive at 68.83, but it follows a golden cross positive column, rather than being a contraction from negative values, and the RSI is only at 52.77, not recovering from below 30. Therefore, the buy conditions are not met.
Now, let’s verify the sell conditions. First, the price must be under pressure below EMA55. The current price is above EMA55, which does not meet the criterion. Second, there must be resistance encountered. The 1-hour level shows no significant long upper shadow or top formation. Third, the rebound must be weak. The 1-hour MACD shows a golden cross, but the histogram is shortening, with the RSI remaining neutral and no clear signals of weakness from the rebound. Thus, the sell conditions are also not met.
In summary, the current TPV system does not provide clear buy or sell signals, indicating a state of ambiguous boundary fluctuations between bullish and bearish sentiments. In such times, Sister Qinglan recommends not to force trades and to wait for clearer signals.
On-chain Capital Situation
In terms of on-chain data, the fear and greed index is unknown, but considering market sentiment, after the inflation data was released, panic sentiment has warmed somewhat. The market share of BTC is at 58.28%, still at a high level, indicating that capital remains in Bitcoin for risk aversion, with no significant movement towards altcoins. Whales have increased their ETH long positions to 245 million USD, with an average price of 2,271 USD, which is a short-term bullish signal but primarily affects ETH with limited influence on BTC. Aave has restored rsETH and destroyed the attackers' assets, which has a repairing effect on DeFi confidence. BlackRock submitted a new tokenized fund application, benefiting the RWA sector. Overall, the on-chain capital situation is neutral without a distinct unilateral drive.
Key Attack and Defense Levels
The most critical attack and defense level currently is the 1-hour EMA55, at 80,942.96. This position is the watershed between bulls and bears. If the price can stabilize and close above 80,942 for two consecutive candlesticks, the bulls are expected to test the area between 81,500 and 82,000. If the price falls below 80,942 and closes below it for two consecutive candlesticks, the bears will take control, with lower support at 80,500 and the psychological level at 80,000. If 80,000 is lost, the next support level is around 79,500.
Trading Thoughts
Based on the signals from the TPV system, there is currently no clear direction. Sister Qinglan provides two trading thoughts under different scenarios, and everyone should respond flexibly based on actual movement.
Scenario One: If the price stabilizes above the 1-hour EMA55, closing above 80,942 for two consecutive candlesticks, and a support stabilization signal appears, such as a long lower shadow or bottom formation, while the MACD histogram shortens for two consecutive periods, a light long position can be taken. The entry point is in the 81,000 to 81,100 range, with a stop loss set at 80,700, and the first target at 81,500, and then looking at 82,000.
Scenario Two: If the price falls below the 1-hour EMA55, closing below 80,942 for two consecutive candlesticks, and a resistance encounter signal appears, such as a long upper shadow or top formation, while the MACD histogram shortens for two consecutive periods, a light short position can be taken. The entry point is in the 80,800 to 80,900 range, with a stop loss at 81,200, with the first target at 80,500, and then seeing 80,000.
If the price oscillates repeatedly near 80,942 without a clear breakout, Sister Qinglan advises to watch for opportunities and not to force trades. In oscillating markets, chasing after peaks and valleys is the easiest way to incur losses.
Risk Warning
The current bullish and bearish boundaries are ambiguous, and the risks of line-fluctuation are high; do ensure to control positions and enforce strict stop losses.
Follow the Qinglan Crypto Classroom to seize more trading opportunities! Welcome to visit the official website www.qinglan.org
📊 Qinglan TPV Trading Strategy Backtest Reference
🕒 Last Backtest Time 05-13 07:00:02
Total Analysis: 1490 Backtests: 1484 Accuracy Rate: 66% (980/1484)
免责声明:本文章仅代表作者个人观点,不代表本平台的立场和观点。本文章仅供信息分享,不构成对任何人的任何投资建议。用户与作者之间的任何争议,与本平台无关。如网页中刊载的文章或图片涉及侵权,请提供相关的权利证明和身份证明发送邮件到support@aicoin.com,本平台相关工作人员将会进行核查。