Part One: Bitcoin (BTC) Trend Analysis
Current Status Overview:
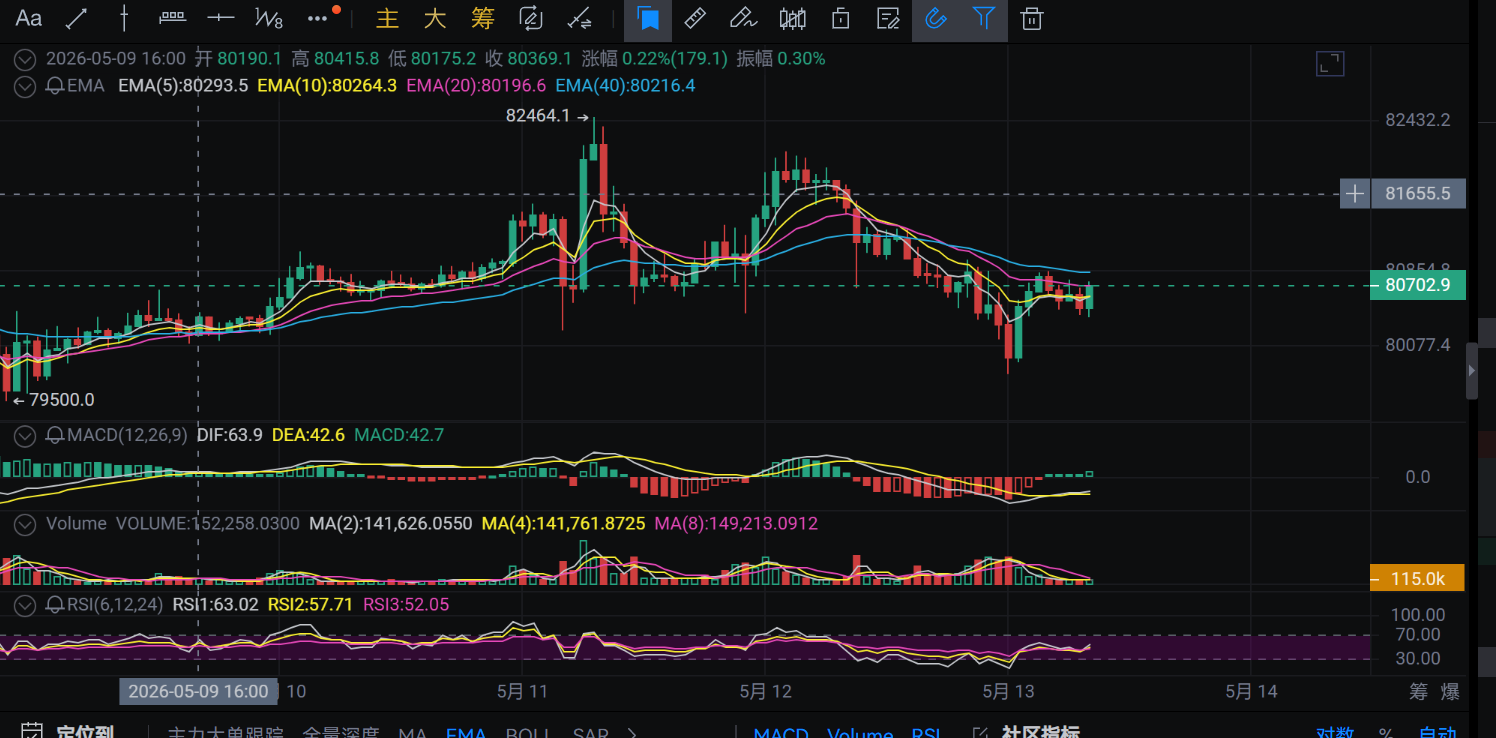
Price Action: The price is currently around 80,702.9. Previously, it experienced a pullback from a high of 82,464.1 and is now trying to stabilize around the 80,000 mark.
Trend Assessment: In the short term, it is in a consolidation phase after a decline. Although the overall trend (EMA moving average system) is bullish, the short-term moving averages are showing signs of a death cross or convergence, indicating weak short-term momentum.
Indicator Deep Dive:
Moving Average System (EMA):
EMA(5) 80293.5 is below EMA(10) 80264.3 and EMA(20) 80196.6, with short-term moving averages entangled together.
The price is barely above EMA(5) and EMA(10), which is a short-term stabilization signal, but the upper EMA(40) 80216.4 constitutes extremely close resistance. The convergence of moving averages suggests a potential trend change is imminent.
MACD (Exponential Moving Average Convergence Divergence):
DIF: 63.9, DEA: 42.6, MACD Bars: 42.7.
The MACD is currently above the zero axis and has a weak golden cross (red bars turning green or green bars shortening), with DIF attempting to cross above DEA. This is a positive signal, suggesting that bearish momentum is waning and bulls are attempting to counterattack, but the momentum is not strong.
Volume:
During the decline, volume did not significantly increase (panic selling has not occurred), and volume during the rebound is relatively muted. This indicates that the market is currently in a wait-and-see state, lacking a dominant direction from large funds.
RSI (Relative Strength Index):
RSI1: 63.02, RSI2: 57.71, RSI3: 52.05.
The RSI indicator is in the 50-60 range, indicating a neutral to strong area. It has not entered overbought territory (>70), suggesting there is still room for an increase; it also has not entered oversold territory, indicating insufficient bearish momentum.
Comprehensive Assessment and Strategy:
Key Support Levels: 80,000 (psychological level) - 79,500 (previous low).
Key Resistance Levels: 81,655 (recent consolidation top) - 82,464 (previous high).
Trend Forecast: Bitcoin is currently in a "pressure above, support below" narrow consolidation phase. The weak golden cross in MACD indicates that there might be a minor rebound in the short term attempting to test resistance around 81,600.
Contract Recommendations:
Long Position: If the price retests 80,000 without breaking it and there is a small bullish divergence, a small long position can be taken, with a stop-loss set at 79,400.
Short Position: If the price rebounds to around 81,600-81,800 and faces resistance (a long upper shadow occurs), it is a good entry point for short positions, targeting a return to 80,500.
Part Two: Ethereum (ETH) Trend Analysis
Current Status Overview:
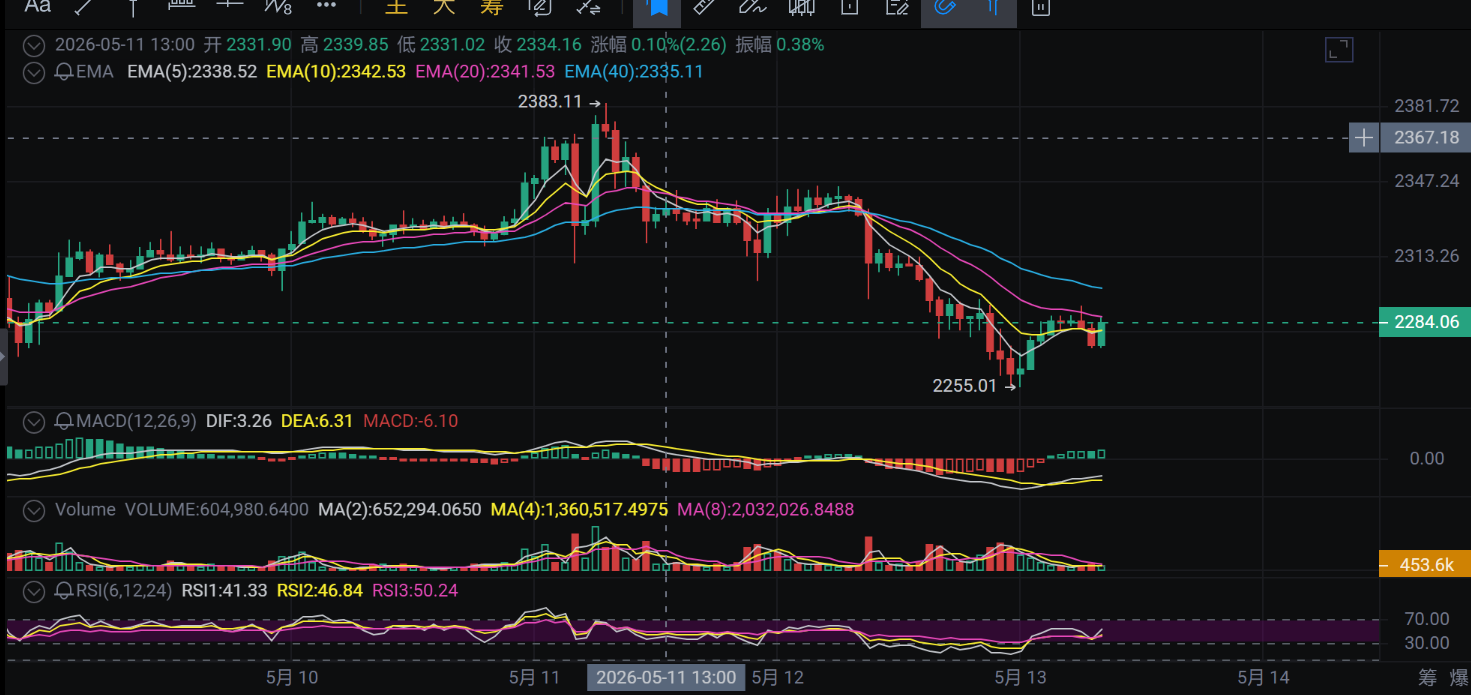
Price Action: The price is currently around 2284.06. The trend is weaker than Bitcoin, having experienced a significant drop (from 2383 to 2255) and is now in a sideways phase following an oversold rebound.
Trend Assessment: A clear bearish trend in the short term, although it has stopped falling, the rebound lacks strength.
Indicator Deep Dive:
Moving Average System (EMA):
EMA(5) 2338.52 > EMA(10) 2342.53 > EMA(20) 2341.53.
Key Point: The price (2284) is far below all short-term moving averages (EMA 5/10/20/40). This is a typical bearish alignment, with moving averages forming layers of resistance above (especially in the 2330-2340 area). As long as the price cannot break through EMA(20) significantly, the downtrend remains unchanged.
MACD:
DIF: 3.26, DEA: 6.31, MACD Bars: -6.10.
The MACD is below the zero axis. Although the green bars (bearish momentum) are shortening, and DIF shows signs of turning upward, it is still overall in a weak underwater zone. This is a "stop falling" signal and not a "reversal" signal.
Volume:
During the sharp decline (2380 -> 2255) volume increased, indicating heavy selling pressure. During the rebound phase, volume shrank, suggesting insufficient buying.
RSI:
RSI1: 41.33, RSI2: 46.84, RSI3: 50.24.
The RSI is below 50, in a weak area. This indicates that selling pressure is still slightly dominant at present.
Comprehensive Assessment and Strategy:
Key Support Levels: 2255.01 (previous low, very important; breaking below opens up greater downside potential).
Key Resistance Levels: 2335 (EMA moving average cluster) - 2367 (previous platform resistance).
Trend Forecast: Ethereum is currently weaker than Bitcoin. Although it rebounded from 2255, it is subjected to the overhead moving average pressure, with a high probability of a second bottom test. If the second bottom test does not break 2255, a bottom can be confirmed; if it directly breaks, it will accelerate the decline.
Contract Recommendations:
Short Position (Preferred): Shorting on rallies is the main strategy. If the price rebounds to around 2320-2335 and there are signs of stagnation, one can enter short positions with a stop-loss set at 2350, targeting 2260.
Long Position (Higher Risk): Unless the price firmly holds above 2340, heavy long positions are not recommended. Aggressive traders can seek short-term longs around 2260 but with strict stop-loss rules.
Summary and Comparison
Strength Comparison: Currently, Bitcoin (BTC) is stronger than Ethereum (ETH). BTC is in a high-position consolidation, trying to adjust indicators; ETH, on the other hand, is in weak recovery after a sharp drop, with heavy trapped positions above.
Correlation: If BTC breaks below 80,000, ETH will most likely break below 2255 and set new lows.
Operational Core:
BTC: Pay attention to the gains and losses around the 80,000 mark, employing a range trading strategy (buy low, sell high).
ETH: The trend is bearish; rebounds present shorting opportunities, and caution is advised for second bottom testing risks.

The above article is analyzed by: (Warm-hearted Talks on Currency). For more cryptocurrency information, scan the code to follow the official account and communicate with me. Articles are sent with a delay, and the content is for reference only. I have many years of research experience in cryptocurrency, and everyone is welcome to learn.
Risk Control Reminder: The current market is in a direction selection period, volatility may decrease, but spike events can occur at any time. Please be sure to control leverage (recommended not to exceed 5-10 times) and set strict stop-loss orders.
免责声明:本文章仅代表作者个人观点,不代表本平台的立场和观点。本文章仅供信息分享,不构成对任何人的任何投资建议。用户与作者之间的任何争议,与本平台无关。如网页中刊载的文章或图片涉及侵权,请提供相关的权利证明和身份证明发送邮件到support@aicoin.com,本平台相关工作人员将会进行核查。