Academician of the Coin Circle: On May 13, the lower Bollinger Band of Ethereum is under pressure, will it rebound or enter a new round of decline? Latest market analysis and operational suggestions
The current price of Ethereum is 2280. I already entered the market early at 2265! This downtrend makes people anxious, and I know many are afraid of continued sell-offs, but I actually see this as an opportunity to make money. Don’t let short-term fluctuations scare you; I have been monitoring the market for so long that I recognize the value at this position. Follow me, no frills, I’ll give you the actual trading level directly, no nonsense, let’s wait together for this rebound to profit, and today we’ll see if we can first stabilize above 2300!
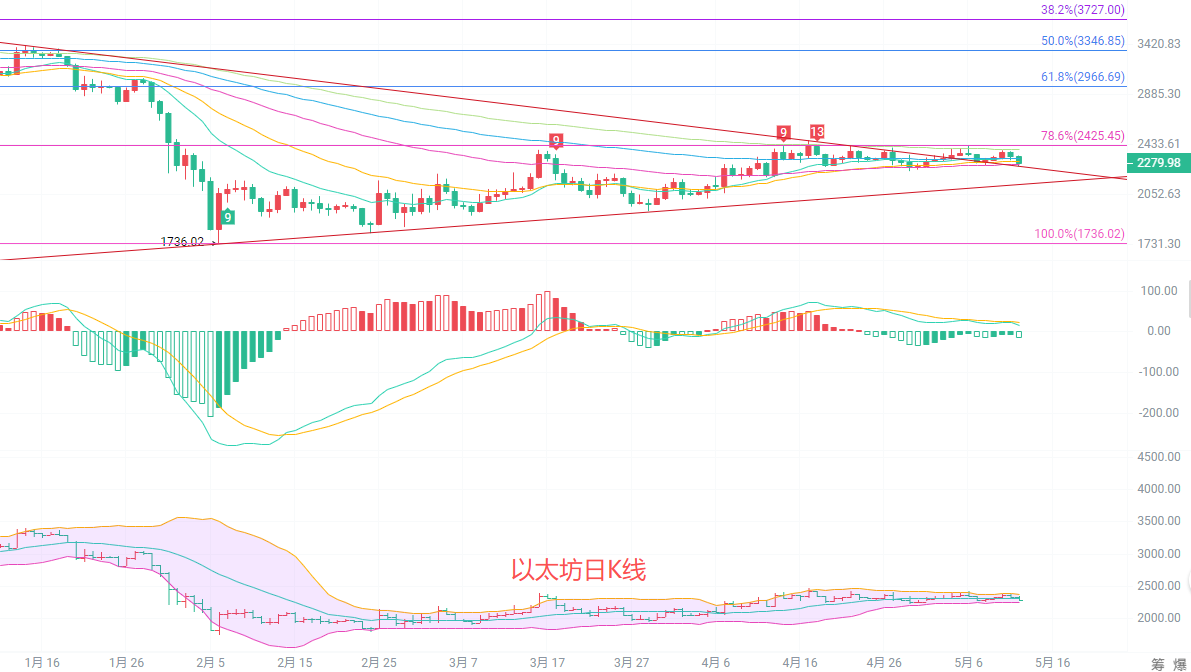
From the daily candlestick chart, it has already broken below the EMA15 and EMA30 short-term moving averages, indicating a short-term weakness. The MACD indicator shows that DIF has crossed below DEA, and the green bars are continuously expanding, indicating that the downward pressure is being released. The middle line of the Bollinger Band around 2316 forms strong resistance, and the price is currently operating below the middle line, overall in a weak oscillating pattern. If it cannot quickly recover 2300, it is highly likely to continue testing the lower Bollinger Band support around 2250.
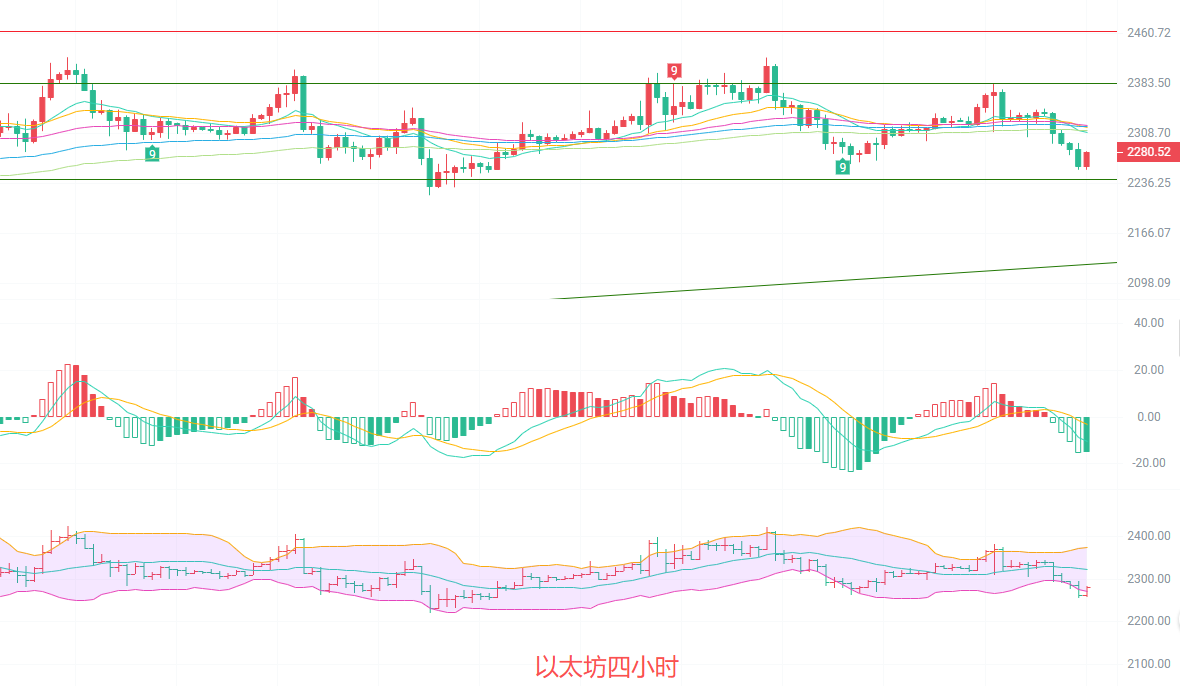
The four-hour candlestick chart has broken below all short-term moving averages EMA15, EMA30, and EMA60, forming a downward arrangement. The MACD indicator shows that DIF is operating below DEA, with green bars continuously expanding, indicating strong downward momentum. The Bollinger Band is opening downwards, and the price is operating near the lower band, indicating a short-term bearish trend. However, there is support at the previous low around 2255, and after a short-term overselling, there is a technical rebound demand, with the rebound height first looking at the 2300-2320 range.
Short-term reference:
Buy up from 2240 to 2220, stop loss at 2200, target at 2280 to 2300
Sell down from 2300 to 2320, stop loss at 2340, target at 2260 to 2240
I have been trading for so long, and I only believe in one principle: when others panic, I am greedy. I directly provide the actual trading level, no playing back the tape, today I’ll take you to witness whether this rebound can take off, hold on tight and don’t fall behind!

Warm reminder: The above content is solely created by the author on Weibo, and the advertisements at the end of the article and in the comments section are not related to the author. Please be cautious in distinguishing them. Thank you for reading.
免责声明:本文章仅代表作者个人观点,不代表本平台的立场和观点。本文章仅供信息分享,不构成对任何人的任何投资建议。用户与作者之间的任何争议,与本平台无关。如网页中刊载的文章或图片涉及侵权,请提供相关的权利证明和身份证明发送邮件到support@aicoin.com,本平台相关工作人员将会进行核查。