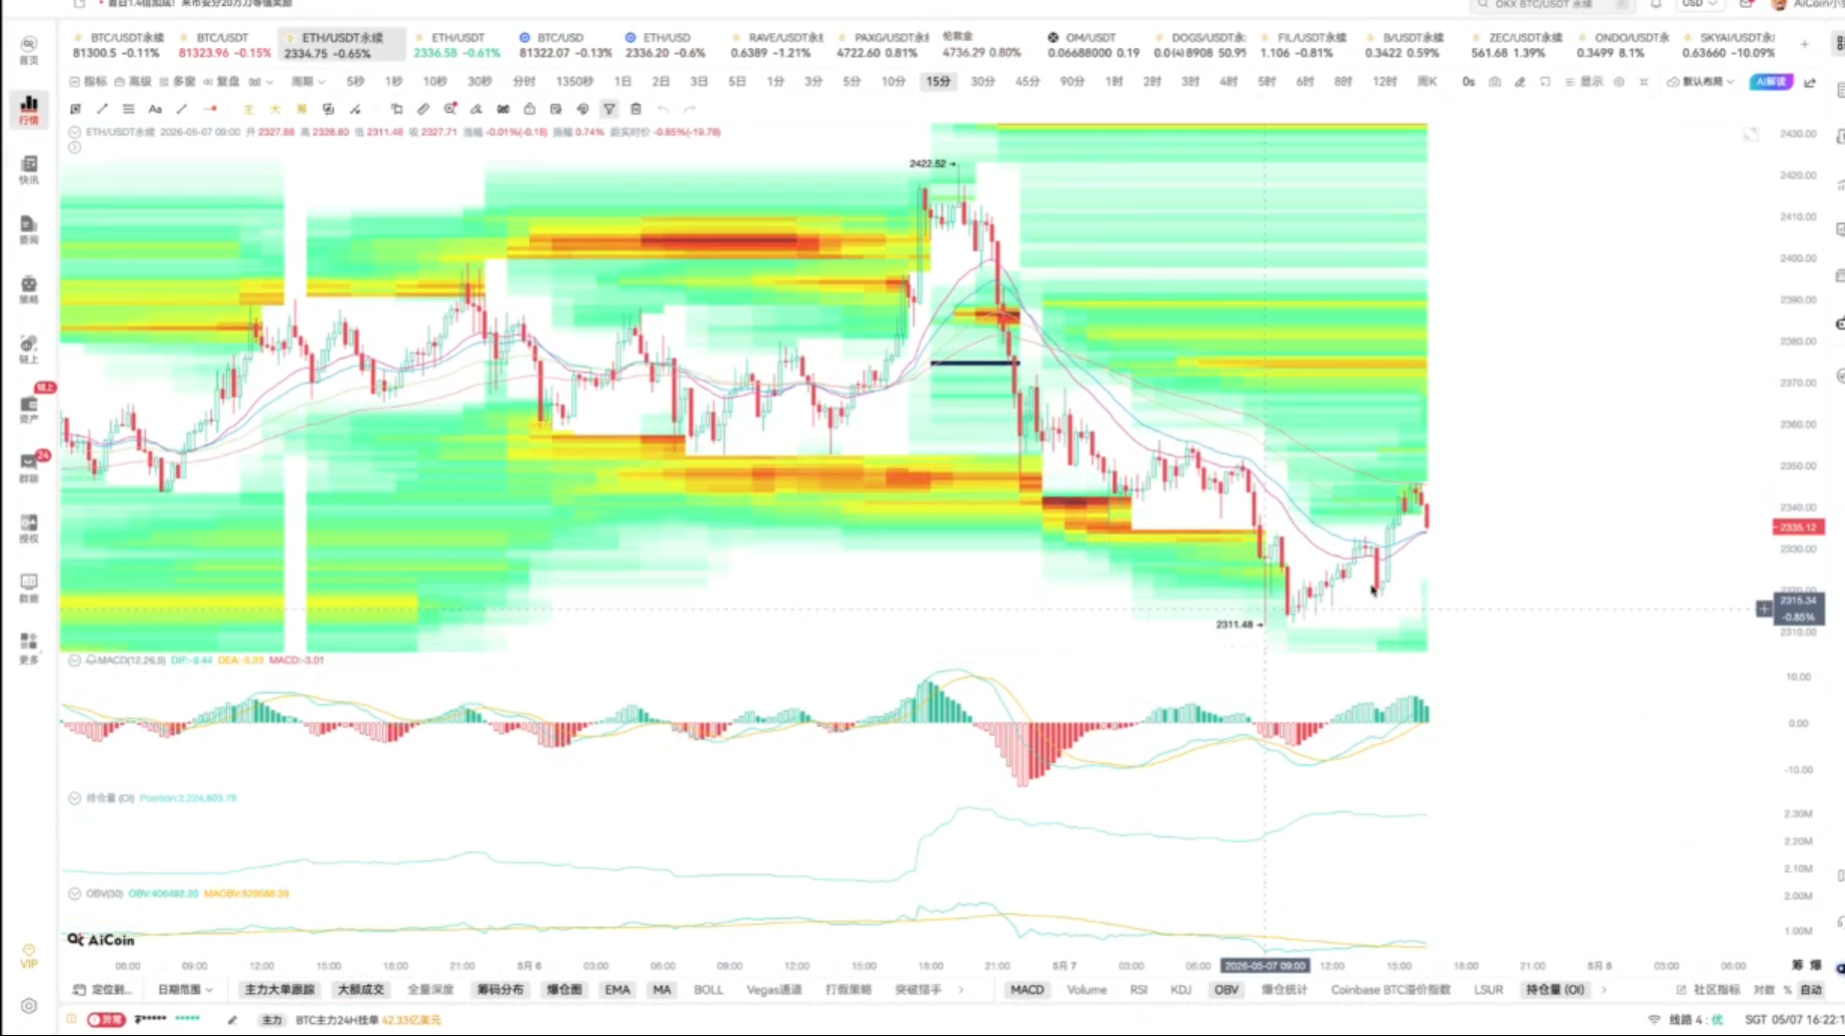
Everyone usually uses the BOLL indicator, also known as Bollinger Bands, when watching the market. Many people are always looking for the simplest and most intuitive support and resistance lines. In fact, Bollinger Bands are the most readily available and highly valuable tools, requiring no complex calculations or tedious judgments, allowing for quick and straightforward use. Bollinger Bands are one of the most popular technical analysis tools in today's trading scenes, consisting of three lines: the upper band, the middle band, and the lower band. We only need to check BOLL in the indicator options to display these three lines directly on the candlestick chart, clearly presenting the market trajectory. 


No need to delve into complex calculation formulas; simply understanding the core logic is enough for practical use. The middle band of Bollinger Bands is the 20-period simple moving average MA20, with the upper and lower bands distributed on both sides of the middle band. The distance between the two is determined by the standard deviation of the price. Simply put, this indicator is a patterned indicator based on recent market prices formed through mathematical algorithms. The width changes of the upper and lower bands directly reflect the fluctuations in market prices, which is also the key to using Bollinger Bands to assess market conditions. We often struggle with whether the current market is consolidating or trending. With Bollinger Bands, it is easy to distinguish. When the bands contract and the three lines come close together, it indicates that the market has entered a period of consolidation with low volatility. When the distance between the bands continually expands, it indicates that market volatility has significantly increased, and prices will follow a clear trend. Referring to the candlestick chart, one can clearly see that the area where the bands open corresponds to when the prices have moved through a smooth upward trend.

Here, I want to share a very useful technique in practical use, which I call the "expansion and contraction" pattern of Bollinger Bands. Contraction means the bands tighten, and the market maintains a consolidating trend.


Expansion means the bands widen, and the market establishes a clear trend. Using this pattern for judgment allows for precise control of entry and exit points in different market scenarios, maximizing practicality. Once you understand the expansion and contraction pattern, I will teach you how to find support and resistance levels using Bollinger Bands. The core is to closely monitor the upper and lower bands. With the indicator checked, it becomes evident that for most of the time, prices are constrained within the Bollinger channel and rarely deviate from the bands.


This means that the upper and lower bands serve as natural strong support and resistance levels. Even if prices occasionally break above the upper band briefly, they are likely to fall back into the channel afterward, and similarly, if the lower band is briefly broken, it will quickly rebound. This is the most basic application method of support and resistance with Bollinger Bands. After mastering the basic usage, I will share a complete Bollinger Bands practical trading strategy today. This strategy combines three core elements: price, upper band, and lower band, including three buy points and three sell points, which are simple to remember and easy to implement. 
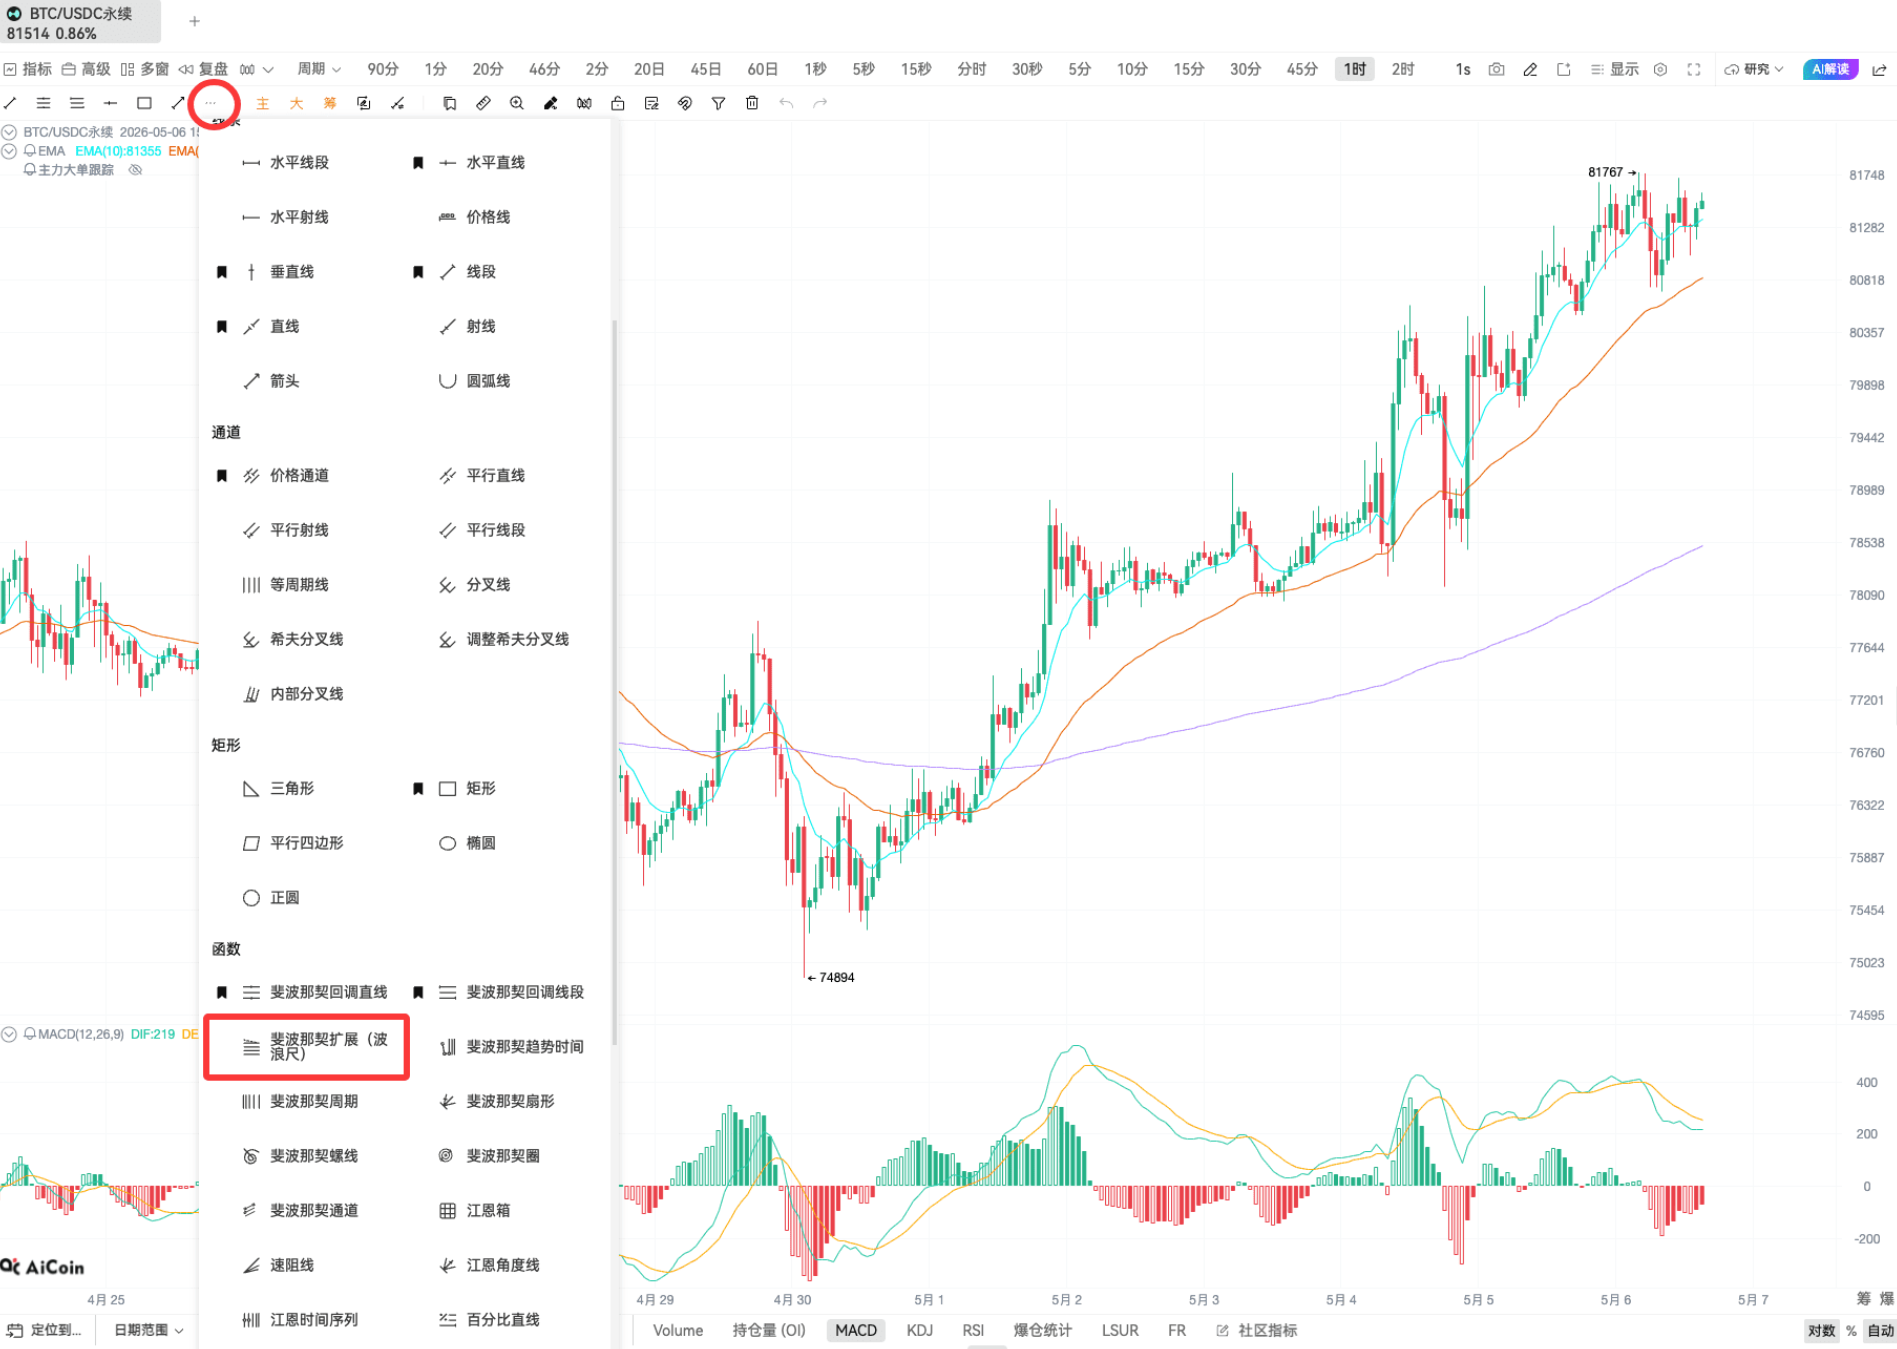
The first buy point appears when the price first moves along the Bollinger lower band, then gradually moves away from the lower band, finally successfully breaking through the middle band. Using BTC's candlestick movement as an example, this is a very classic practical pattern. Switching to the one-minute real-time BTC candlestick chart can clearly verify the effectiveness of this buy point.


The second buy point is established based on the first buy point's validation. The price retraces to near the middle band, preferably not breaking below it; even if it briefly breaks below, it can quickly recover and stabilize. This position often tests the strength of support, making it a highly secure entry timing.
The third buy point requires that the first two buy points are successfully established. After the price breaks through the upper band, if there is a retracement and it stabilizes at the middle band without breaking below it or quickly recovering back up, it forms the third buy point. This indicates that our trend judgment is completely correct, and a retracement to the middle band remains a reliable entry opportunity. Referring to the candlestick chart, this logic can be easily understood.

The judgment logic for the three sell points is completely opposite to that of the three buy points. By reversing the thought process of the buy points, you can quickly master the use of sell points. In practice, it is more advisable to focus on the first and second buy points, as the third buy point is relatively harder to control. The second buy point is suitable for most traders; there is no need to be greedy in pursuit of extreme profits. Securing profits within the trend is sufficient.
That concludes today's sharing on Bollinger Band and on-chain K line investment techniques, from basic understanding and pattern judgment to complete practical trading strategies. I hope it can help every friend who loves analyzing the market with Bollinger Bands. Practice often with candlestick charts, and soon you will be able to apply this method skillfully.
This article represents the author's personal views and does not reflect the platform's position or perspective. This article is for information sharing only and does not constitute any investment advice to anyone.
免责声明:本文章仅代表作者个人观点,不代表本平台的立场和观点。本文章仅供信息分享,不构成对任何人的任何投资建议。用户与作者之间的任何争议,与本平台无关。如网页中刊载的文章或图片涉及侵权,请提供相关的权利证明和身份证明发送邮件到support@aicoin.com,本平台相关工作人员将会进行核查。