We will directly analyze these two real-time candlestick charts, conducting the most authentic market scenario simulation. I won't talk about vague concepts, but will dive straight into the practical content, rigorously dissecting the current bullish and bearish logic from the perspective of a practical trader.
Special Reminder: Contract trading involves leveraged speculation. The following analysis is based on technical patterns, please be sure to set proper stop-losses.
Part One: Bitcoin (BTC) — Chart One Analysis
Current Status: High volatility, intensified bullish and bearish divergence, waiting for directional choice.
Market Interpretation (1-hour chart):
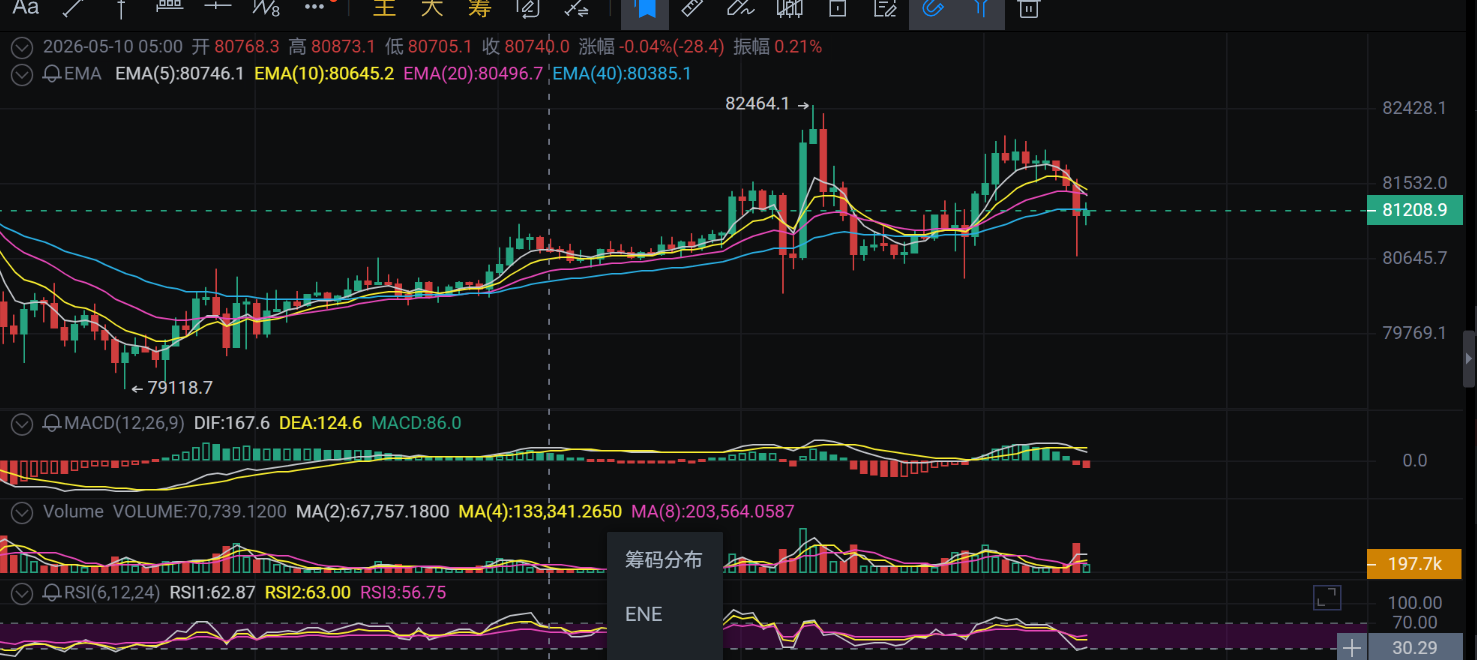
Price Action: The current price is around 81107. You can see the price is repeatedly entangled around the EMA(40) 81230.5 moving average.
Key Pattern: There was a previous spike to 82464.1 that met resistance and fell back, currently in the recovery phase after the drop. The candlestick bodies are small, with intertwining upper and lower shadows, indicating that at this position, bulls are hesitant to aggressively attack, and bears are not aggressively shorting; the market is in a “consolidation” phase.
Indicator Signals: The MACD indicator below appears to be consolidating near the zero line, and momentum is weak. This is usually a precursor to a change in trend.
Trading Logic and Price Levels:
Trend Judgment: Currently, it is a high-level bullish bias (because it is still consolidating at a high level, and has not broken down), but there is short-term retracement pressure.
Key Price Levels:
Resistance Level (Short Position Defense): 81800 - 82000. This is a dense trading zone near the previous high.
Support Level (Long Position Defense): 80000 - 80200. This is a round number and also a psychological barrier.
Trading Suggestions:
Strategy One (Short-term Short): If the price rebounds to around 81600-81800, and a long upper shadow appears, consider trying to short with light positions. Set a stop-loss at 82100, targeting back to 81000 or even 80500.
Strategy Two (Conservative Long): If the price dips to 80200-80500 and holds without breaking, and shows a signal of stopping the decline (like a bottom formation), consider going long. Set a stop-loss at 79800, targeting 81500.
Win Rate Assessment: 55%. Currently, it's "garbage time," oscillating markets easily result in getting stopped out; unless breaking key levels, the win rate is generally average.
Part Two: Ethereum (ETH) — Chart Two Analysis
Current Status: Breakout downward, bears dominate, trend getting worse.
Market Interpretation (1-hour chart):
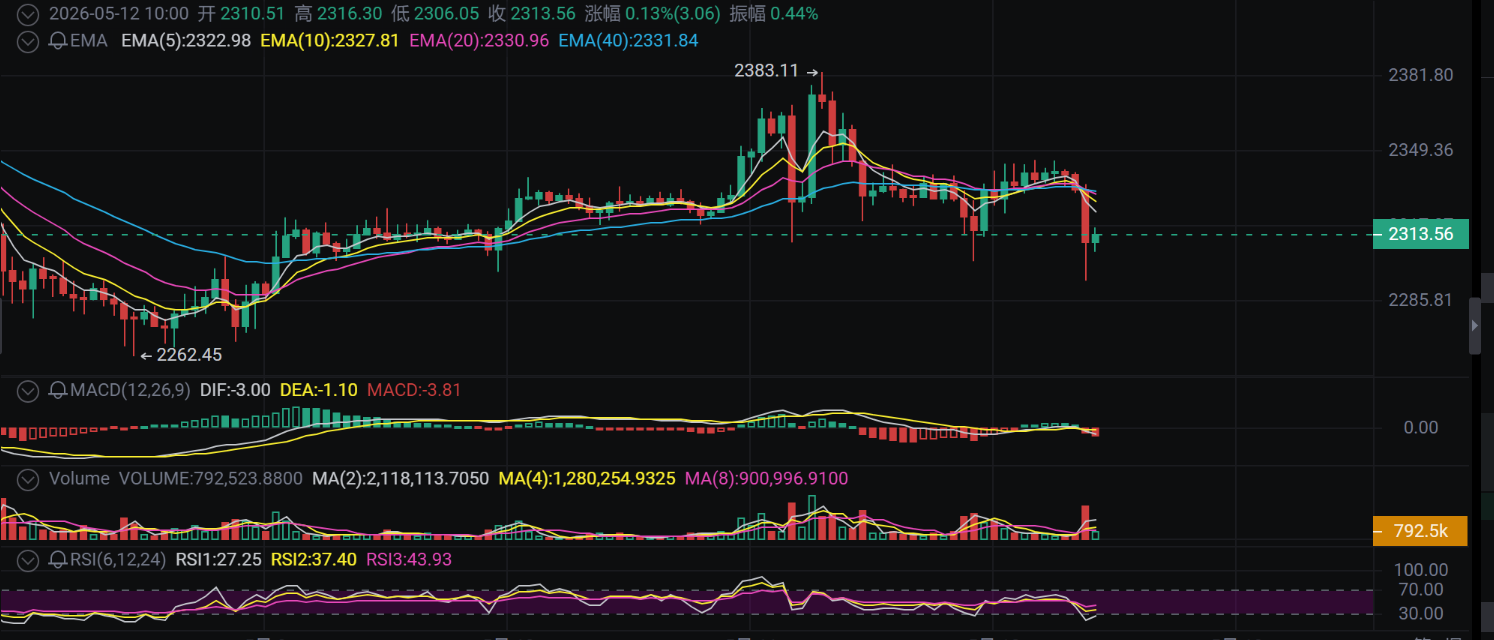
Price Action: Current price 2314.31. This chart looks much worse than BTC. You can see a large bearish candlestick broke through the moving average support (EMA40 at 2331), and now the candlestick is operating below the moving average, forming a typical “bearish structure”.
Key Pattern: The previous high of 2383.11 formed a clear "M-top" or top structure, and is now moving in the downward wave of the right side.
Indicator Signals: MACD has crossed down, green bars are increasing, indicating that the downward momentum is still being released, and has not yet reached the bottom divergence.
Trading Logic and Price Levels:
Trend Judgment: Short-term bearish. The trend is your friend, and the trend is clearly down now.
Key Price Levels:
Resistance Level (Short Entry Point): 2330 - 2340. The EMA moving average just broken has now become a resistance level, and a pullback here is likely to meet resistance.
Support Level (Target Below): 2285 (the previous low displayed on the right scale of the chart). If this level is broken, it will accelerate the decline.
Trading Suggestions:
Core Strategy (Short on Rally): This is currently the strategy with the highest win rate. Wait for a small rebound to repair indicators, when it touches the 2325 - 2335 range, enter short decisively.
Stop-Loss: Must be strictly set above 2345 (if it returns above 2345, it indicates a failed breakout, and you must exit).
Take Profit: First target at 2300, second target at 2285.
Win Rate Assessment: 70%. Because the trend is clearly down, the win rate of going short with the trend is much higher than counter-trend bottom fishing.
Part Three: Ultimate Showdown — Which Has a Higher Win Rate?
Conclusion: The win rate for shorting Ethereum (ETH) is higher.
Reasons are as follows:
Clarity of Patterns: BTC is oscillating (sideways), with unclear direction, making it easy to get stopped out; ETH has a unilateral downward trend with a clear direction (downward). A fundamental trading rule: Do not trade in oscillations, only trade in a unilateral trend.
Momentum Comparison: ETH has just completed a breakout, downward momentum is being released; BTC is in a period of momentum exhaustion, currently gathering strength.
Difficulty of Operation: BTC requires you to accurately judge the highs and lows of the oscillation range, which is challenging; ETH only requires you to see a weak rebound to go short, making the logic simple.
Final Recommendation from Experts:
Focus on ETH trades. Do not chase short at the current 2314 (risking entering at the bottom), patiently wait for it to rebound about 10-15 dollars, and when it approaches 2325-2330, that will be a short opportunity where the main force hands you money.

Remember: It's better to miss than to get it wrong. Set proper stop-losses, and good luck!The above article was analyzed by: (Warm Heart Talking Currency),to learn more about cryptocurrency news, scan the code to follow the public account and communicate with me,the article may have delays in sending, content for reference only. I have many years of research experience in cryptocurrency, feel free to study.
免责声明:本文章仅代表作者个人观点,不代表本平台的立场和观点。本文章仅供信息分享,不构成对任何人的任何投资建议。用户与作者之间的任何争议,与本平台无关。如网页中刊载的文章或图片涉及侵权,请提供相关的权利证明和身份证明发送邮件到support@aicoin.com,本平台相关工作人员将会进行核查。