In the K-line chart, there is a type of pattern that is particularly easy to recognize and also particularly “dangerous” — it looks like a sharp tower, and its name isTower Top. Whether trading stocks or cryptocurrencies, as soon as you see it at a high position, you must immediately tighten your nerves: the market is highly likely to reverse and decline. Today, we will explain this pattern, its origin, how to look at it, and how to use it, all at once.
1. What does the Tower Top look like? Recognize it in three steps
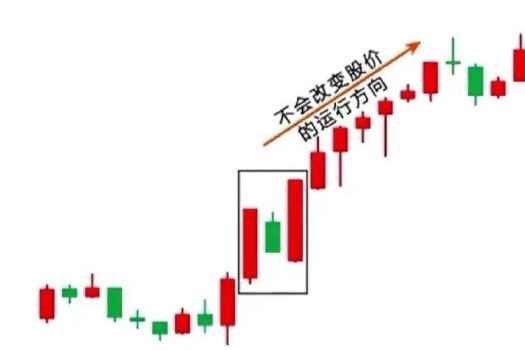
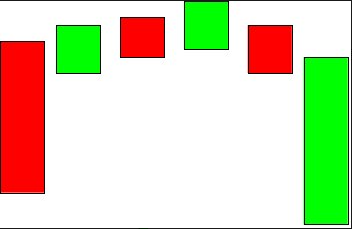
The structure of the Tower Top is particularly orderly, just like building blocks, divided into **“Large Bullish Candle → Small K-Line Fluctuation → Large Bearish Candle”** three segments, which can be seen at a glance.
Step 1: A “Large Bullish Candle” appears at a high position The stock price (or cryptocurrency price) has risen for a period and reaches a high point when suddenly a long solid bullish candle appears, looking particularly strong as if it will continue to rise significantly, attracting retail investors to follow and chase high.
Step 2: Sideways consolidation at a high position, a bunch of small bullish and bearish “playing around” After the large bullish candle, the price no longer rises, just fluctuating narrowly at a high level, resulting in a bunch of very short solid small bullish and bearish candles, with occasional doji. On the surface, the trend looks stable, not falling, but in fact, the main force is quietly distributing stock — you buy, they sell, slowly transferring the chips to retail investors.
Step 3: A “Large Bearish Candle” crashes, forming the pattern Once the main force has distributed most of its stock, it directly crashes the market, resulting in a long solid bearish candle that directly breaks the previous consolidation platform. As soon as this large bearish candle appears, the Tower Top is officially confirmed, and the downward trend begins.
In brief: First, pull out a large bullish candle to lure in buyers, then consolidate and distribute, and finally drop with a large bearish candle. Once these three steps are completed, the top is formed.
2. The market logic behind the Tower Top: the main force's “luring tactic”
Many people are curious, how can a good bullish market suddenly reverse? In fact, the formation of the Tower Top is entirely a standard procedure of “luring — distributing — crashing” by the main force. Understanding the logic, you won't be confused by appearances.
Large bullish candle is the “luring trap”: When the stock price rises to a high position, the main force wants to distribute, but they can’t without buyers. So they first pull up a large bullish candle, creating an illusion of "strong breakout, more to rise", making retail investors feel “if I don’t buy now, it will be too late,” and they rush to chase high, just as the main force sells the chips to followers.
Sideways consolidation is the “distribution window”: After retail investors rush in, the main force neither pushes up nor drops significantly, but consolidates at a high level. At this point, retail investors feel very conflicted: if they sell, they fear the price will rise, but if they hold on, it doesn’t rise. Most end up choosing to “wait a little longer.” Meanwhile, the main force is gradually distributing all the chips in hand, with trading volume often showing “bullish candles reducing volume, bearish candles increasing volume.”
Large bearish candle is the “crash signal”: Once the main force has offloaded most of their chips and market buying pressure has disappeared, the main force stops supporting the market and directly crashes it. A large bearish candle breaks support, and retail investors panic and start selling, thus forming a downward trend.
In a nutshell:the Tower Top is a carefully arranged “bull trap” by the main force at a high position, aimed at trapping retail investors at the peak.
3. How to use it in practice? 3 key points to avoid being trapped at high positions
Knowing the shape and logic of the Tower Top, you can use it to “escape the peak” in actual trading, preserving profits and avoiding being trapped. Remember these 3 core points, they are simple and easy to execute.
1. First look at the position: Must appear at a “high position after a significant rise”
This is the most critical point! If the stock price hasn’t risen much, and a similar pattern appears at a low position or during an upward trend, it is likely a washout, not a Tower Top; only after a significant rise, when a large amount of profit has accumulated, can it be considered an effective top signal.
2. Then look at the shape: The first and last candlesticks should be “symmetric”, and the middle fluctuations should “not create new highs”
First and last: The previous large bullish candle and the following large bearish candle should have similar body lengths; the “one bullish, one bearish” comparison is stronger, making the signal more accurate.
Middle: The small k-lines during the fluctuations should not exceed the highest price of the previous large bullish candle, which means “it can’t rise anymore.” Once a new high is made, this pattern becomes invalid.
3. Finally, look at volume: “bullish candles increasing volume, fluctuations decreasing volume, and bearish candles increasing volume again”
When the large bullish candle is present: The trading volume significantly increases, indicating that the main force is luring buyers, and there are many following orders.
During fluctuations: Trading volume shrinks, indicating that the main force is controlling the market, while retail trading is light.
When the large bearish candle appears: Trading volume increases again, indicating that the main force is crashing the market, panic selling occurs, confirming the reversal.
Practical operation strategy
If a large bullish candle appears at a high position followed by fluctuations that do not create new highs: be alert and gradually reduce your position, first cash in some profits for safety.
Once a large bearish candle with increased volume appears, breaking the fluctuation platform: decisively exit the market, do not harbor expectations of “selling on a rebound” as once the Tower Top is established, the downward space is usually significant.
4. Common misconceptions: Don’t mistake “washout” for “Tower Top”
Many novices easily misjudge, mistaking the washout during an upward trend as a Tower Top, resulting in selling at low positions and missing the subsequent significant rise. Remember one core distinction: position + rise.
Tower Top: High position after significant rise, main force distributes, reversing downwards.
Washout: During an upward trend with little rise, main force washes out, anticipating further rise.
Additionally, the Tower Top is somewhat similar to the Evening Star, but the Tower Top has a longer fluctuation time in the middle and greater downward space. When it appears in weekly or monthly K-lines, the signal is more reliable.
5. Summary: Tower Top, the “escape signal” at a high position
Ultimately, the Tower Top is not some complex metaphysics, but rather a direct reflection of market capital behavior — the main force lures buyers, distributes, and crashes, step by step trapping retail investors at the peak.
Remember the core mantra: High bullish candle lures, sideways fluctuation distributes, large bearish candle crashes and exits. Next time you see this pattern at a high position, don’t hesitate; exit in time, preserving profits is the real principle.
For more valuable content, follow the public account: Big Bull Talks Market Trends
This content is for the exchange of market views and personal replay thoughts, and does not constitute any investment advice.
免责声明:本文章仅代表作者个人观点,不代表本平台的立场和观点。本文章仅供信息分享,不构成对任何人的任何投资建议。用户与作者之间的任何争议,与本平台无关。如网页中刊载的文章或图片涉及侵权,请提供相关的权利证明和身份证明发送邮件到support@aicoin.com,本平台相关工作人员将会进行核查。