Hello friends, I am Sister Qinglan. Today, the market news is quite lively, with two things worth paying attention to. The first is that the 17th Chairman of the Federal Reserve, Waller, is about to take office, and he plans to abolish the dot plot, which means the future monetary policy path of the Federal Reserve will be more vague, intensifying the market's speculation on interest rate expectations and increasing short-term uncertainty. The second is that negotiations between the US and Iran have stalled, and geopolitical risks have heightened risk aversion, causing Bitcoin to briefly rise above $82,000 before retreating. These two pieces of news present one neutral and one short-term bullish scenario, but neither has been able to drive BTC in a clear direction, and the market overall remains in a wait-and-see state. Our analysis today will focus on extracting real trading signals from this data.
Current price and time
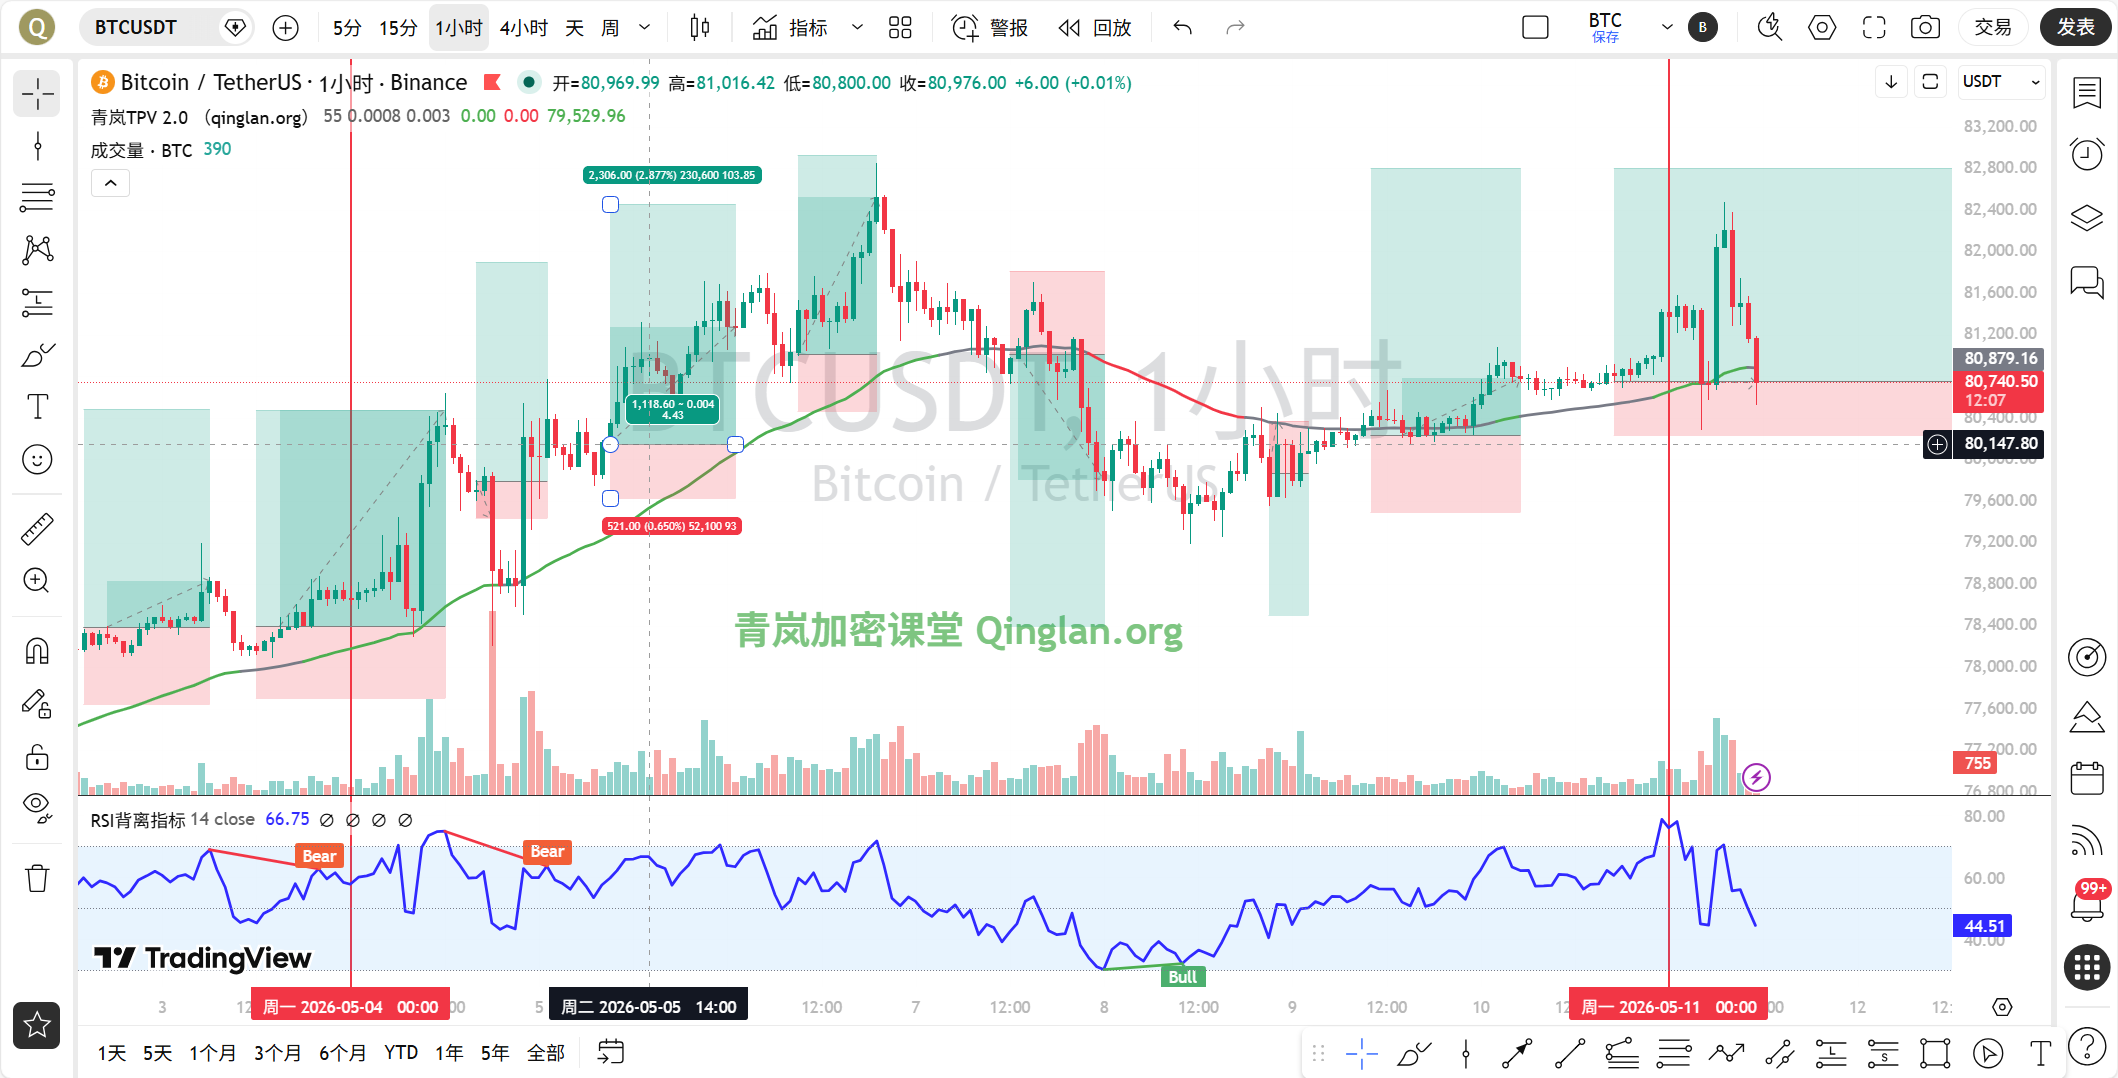
The current time is May 11, 11:45, with BTC quoted at 80,701 USDT. The 24-hour decline is 0.16%, showing little fluctuation, but subtle changes have appeared technically. The Fear and Greed Index stands at 48, indicating a neutral and cautious sentiment, with neither overheating nor panic, which is often a typical characteristic of a consolidating market.
Multi-cycle state overview
First, let's look at the daily chart. The daily MA5 is at 80,757, MA10 is at 80,325, and MA30 is at 77,516, with the moving average system showing a bullish arrangement. However, the gap between MA5 and MA10 is very small, indicating a lack of short-term momentum. The MACD's DIF is at 1,902, DEA at 1,872, and the histogram value is 30.26; although it is still positive, the histogram value has noticeably shortened compared to the previous days, signaling a weakening upward momentum. The RSI stands at 63.16, in a neutral to strong area, but has not entered the overbought territory. Overall, the daily chart is in a bullish structure, but the strength is weakening.
At the 4-hour level, MA5 is at 81,317, MA10 is at 81,024, and MA30 at 80,765, with the price currently oscillating between MA5 and MA10. The MACD's DIF is at 281.89, DEA at 211.30, and the histogram value is 70.59; although still positive, the histogram is also continuously shortening, indicating a decay of bullish momentum at the 4-hour level. The RSI stands at 55.86, neutral and weak. On the 4-hour chart, the price has formed a small platform in the 81,000-81,500 area, with upward strength lacking.
At the 1-hour level, this is our core analysis cycle. MA5 is at 81,410, MA10 at 81,326, and MA30 at 81,035, with the price currently running below MA5 and MA10. The MACD’s DIF is at 142.12, DEA at 196.34, and the histogram value is -54.22, entering negative territory, which is a signal that bearish momentum is beginning to dominate. The RSI is at 47.14, breaking below the 50 midline, leaning bearish. EMA55 is at 80,824.51, and the current price of 80,701 has dropped below EMA55, which is a key signal.
At the 15-minute level, MA5 is at 80,762, MA10 at 81,066, and MA30 at 81,366, with the price running below all moving averages. The MACD’s DIF is at -191.88, DEA at -69.14, and the histogram value is -122.74, indicating strong bearish momentum. The RSI is at 18.31, already entering the oversold area, suggesting a short-term rebound demand; however, the strength of this rebound needs to be observed.
TPV signal validation
Now let's validate using our Qinglan TPV system. The 1-hour EMA55 is at 80,824.51, and the current price is 80,701, below EMA55. According to system rules, we are currently in a bearish trend area.
First, let's look at the auxiliary data for oscillation judgment. In the past 8 one-hour K-lines, the number of times the closing price was greater than EMA55 was 5, and the number of crossovers was 2. The absolute distance from the current price to EMA55 is 0.15%. This fully meets the oscillation judgment threshold, with at least 3 closes on either side and crossover counts greater than or equal to 2, while the price's fluctuation amplitude is less than 0.3%. Therefore, the current 1-hour level is in an oscillating market, not a unilateral bearish market. According to system rules, in an oscillating market, we do not actively long or short, only provide the range.
However, we need to further analyze the boundaries of the oscillation. From the perspective of the 1-hour K-line structure, the price is running below EMA55, but EMA55 itself is still at 80,824 and has not significantly dropped, indicating that the bears do not have complete control. Although the MACD histogram is negative, the cycles of continuous shortening are not enough; currently, we only see one shortened histogram and need at least two consecutive ones to confirm momentum exhaustion. The RSI at 47.14 has not entered the oversold region nor rebounded from it, so the bearish condition of “weak rebound” is also not clear enough.
In summary, the current 1-hour level is in a weak oscillating state but has not triggered a clear short signal. We need to wait for the price to show a clearer formation below EMA55, such as a top divergence or a long upper shadow, while the MACD histogram continuously shortens, before considering short positions. If the price re-establishes itself above EMA55, it could turn into a bullish oscillation.
On-chain capital situation
In terms of on-chain data, the Fear and Greed Index is 48, neutral. BTC market share remains at 58.2%, with no significant changes. The 24-hour decline is 0.16%, showing very little fluctuation. On the news front, 10x Research analysts believe a target price of $88,000 for Bitcoin is achievable, which is bullish, but on-chain data suggests that the rebound is not the start of a bull market and lacks bottom signals, indicating a contradiction between the two. Additionally, a whale transferred 577,000 ETH to Binance, which is bearish and may exert selling pressure on ETH, indirectly affecting BTC sentiment. Overall, the capital situation lacks a clear direction, and the market is waiting for a catalyst.
Key resistance and support levels
The first resistance above is at the 1-hour EMA55 at 80,824. If the price can stabilize at this level, the next resistance is at the 4-hour MA5 at 81,317 and the 1-hour MA30 at 81,035. Further up, although the daily MA5 at 80,757 has been broken, reclaiming it is also critical. The first support below is at the psychological level of 80,000, which is the key defense mentioned by analysts. If it falls below 80,000, the next support levels are at the daily MA10 at 80,325 and the 4-hour MA30 at 80,765, but since 80,765 has already been broken, the actual support should be considered in the 79,500-80,000 range.
Trading thoughts
Given that the current 1-hour level is in an oscillating market, according to Qinglan TPV system rules, we do not actively long or short but only provide the range. However, we can design a buy low sell high strategy based on the boundaries of the oscillation.
Direction: Oscillating bearish, but primarily focused on range trading.
Entry conditions: If the price rebounds to the 80,800-81,000 area, showing a long upper shadow or a top divergence, while the MACD histogram in negative territory does not show significant shortening, we can consider a light short entry. If the price pulls back to the 80,000-80,200 area, showing a long lower shadow or a bottom divergence, while the MACD histogram in negative territory begins to shorten, we can consider a light long entry.
Stop-loss levels: The stop-loss for shorts is set above 81,200; the stop-loss for longs is set below 79,800.
Target levels: The short target looks at 80,200-80,000; the long target looks at 80,800-81,000.
If the price breaks out of the oscillation range, for example, stabilizing above 81,200, it will shift to a bullish perspective; if it falls below 79,800, it will shift to a bearish perspective, chasing shorts in line with the trend.
Risk warning
In an oscillating market, false breakouts are frequent, strict stop-losses, and position size should be kept light.
Stay tuned to Qinglan Crypto Classroom to grasp more trading opportunities together! Welcome to visit the official website www.qinglan.org
📊 Qinglan TPV trading strategy backtest reference
🕒 Last backtest time 05-11 07:00:01
Total analysis: 1445 Backtests: 1439 Accuracy: 65.9% (949/1439)
免责声明:本文章仅代表作者个人观点,不代表本平台的立场和观点。本文章仅供信息分享,不构成对任何人的任何投资建议。用户与作者之间的任何争议,与本平台无关。如网页中刊载的文章或图片涉及侵权,请提供相关的权利证明和身份证明发送邮件到support@aicoin.com,本平台相关工作人员将会进行核查。