Cryptocurrency Expert: As of May 10, Bitcoin is priced at 80740, and the North-South competition is intensifying, these two levels determine the short-term direction! Latest market analysis and operation suggestions
Bitcoin's current price is 80780. Looking back at how Bitcoin rose from 60,000 to now, there are not many who can hold on. Many people run away at a slight rise and panic at a slight drop, ultimately earning no money and collapsing mentally. Trading, in essence, is a game against one's own nature. If you cannot overcome greed and fear, no matter how precise the analysis is, it is useless. The current fluctuations and corrections are merely normal fluctuations on the road to upward movement; do not pay too much attention to short-term ups and downs. Manage risk well and hold the positions that you understand; it is much better than staring at the market every day and making random trades.
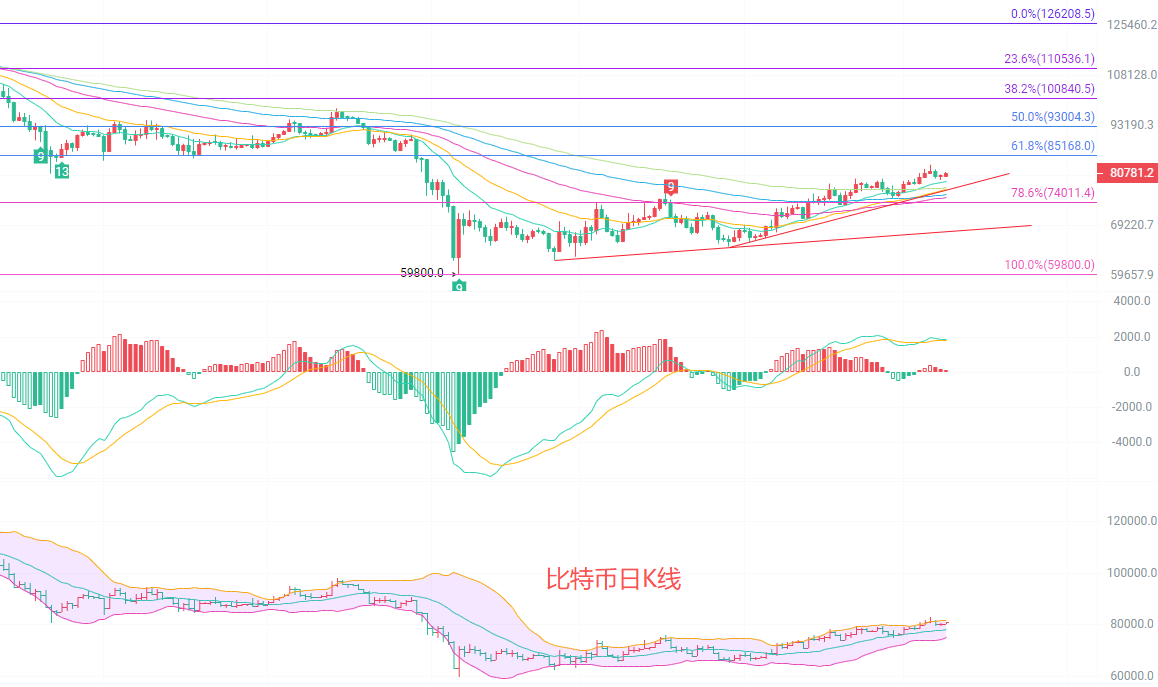
The daily K-line is in the adjustment phase of the upward trend, with prices under pressure near previous highs, and the daily line has formed a doji star, indicating increasing divergence between bulls and bears. Although the moving average system is still arranged upwards, the short-term deviation rate is relatively high, indicating a need for a pullback and correction. The upper band of the Bollinger Bands is clearly under pressure, and the MACD red bars are continuously shrinking, with signs of the fast and slow lines turning down, indicating that the upward momentum is weakening, and there is a need for a short-term pullback, with key support focusing on the 78000-78500 range.
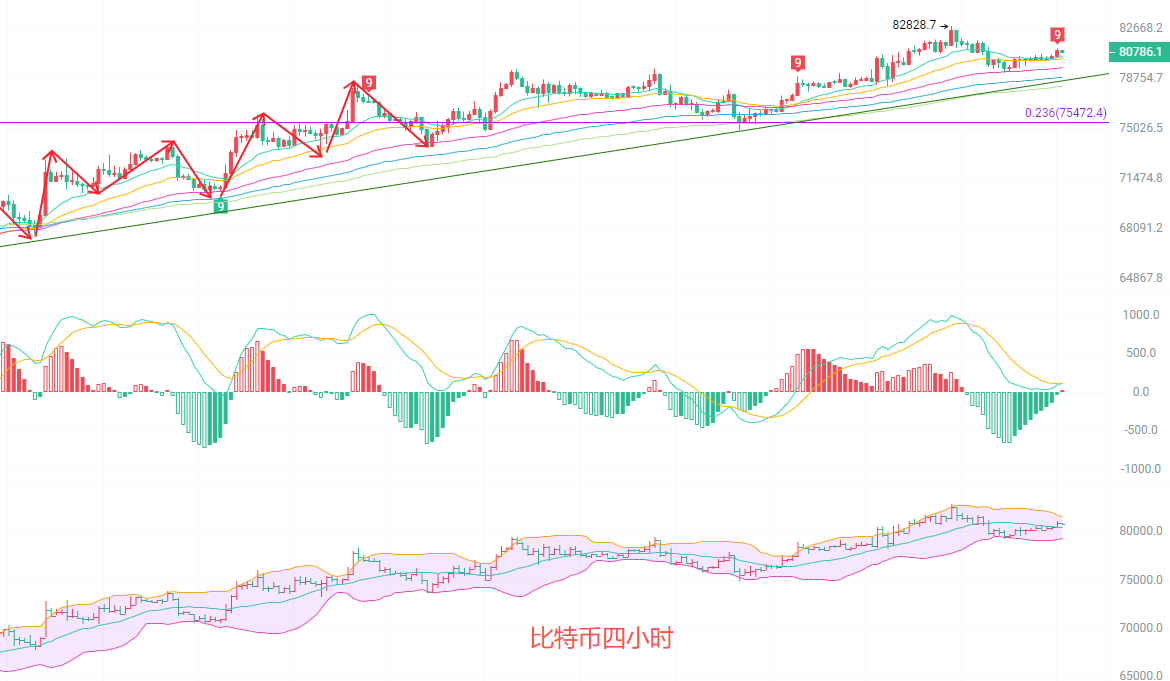
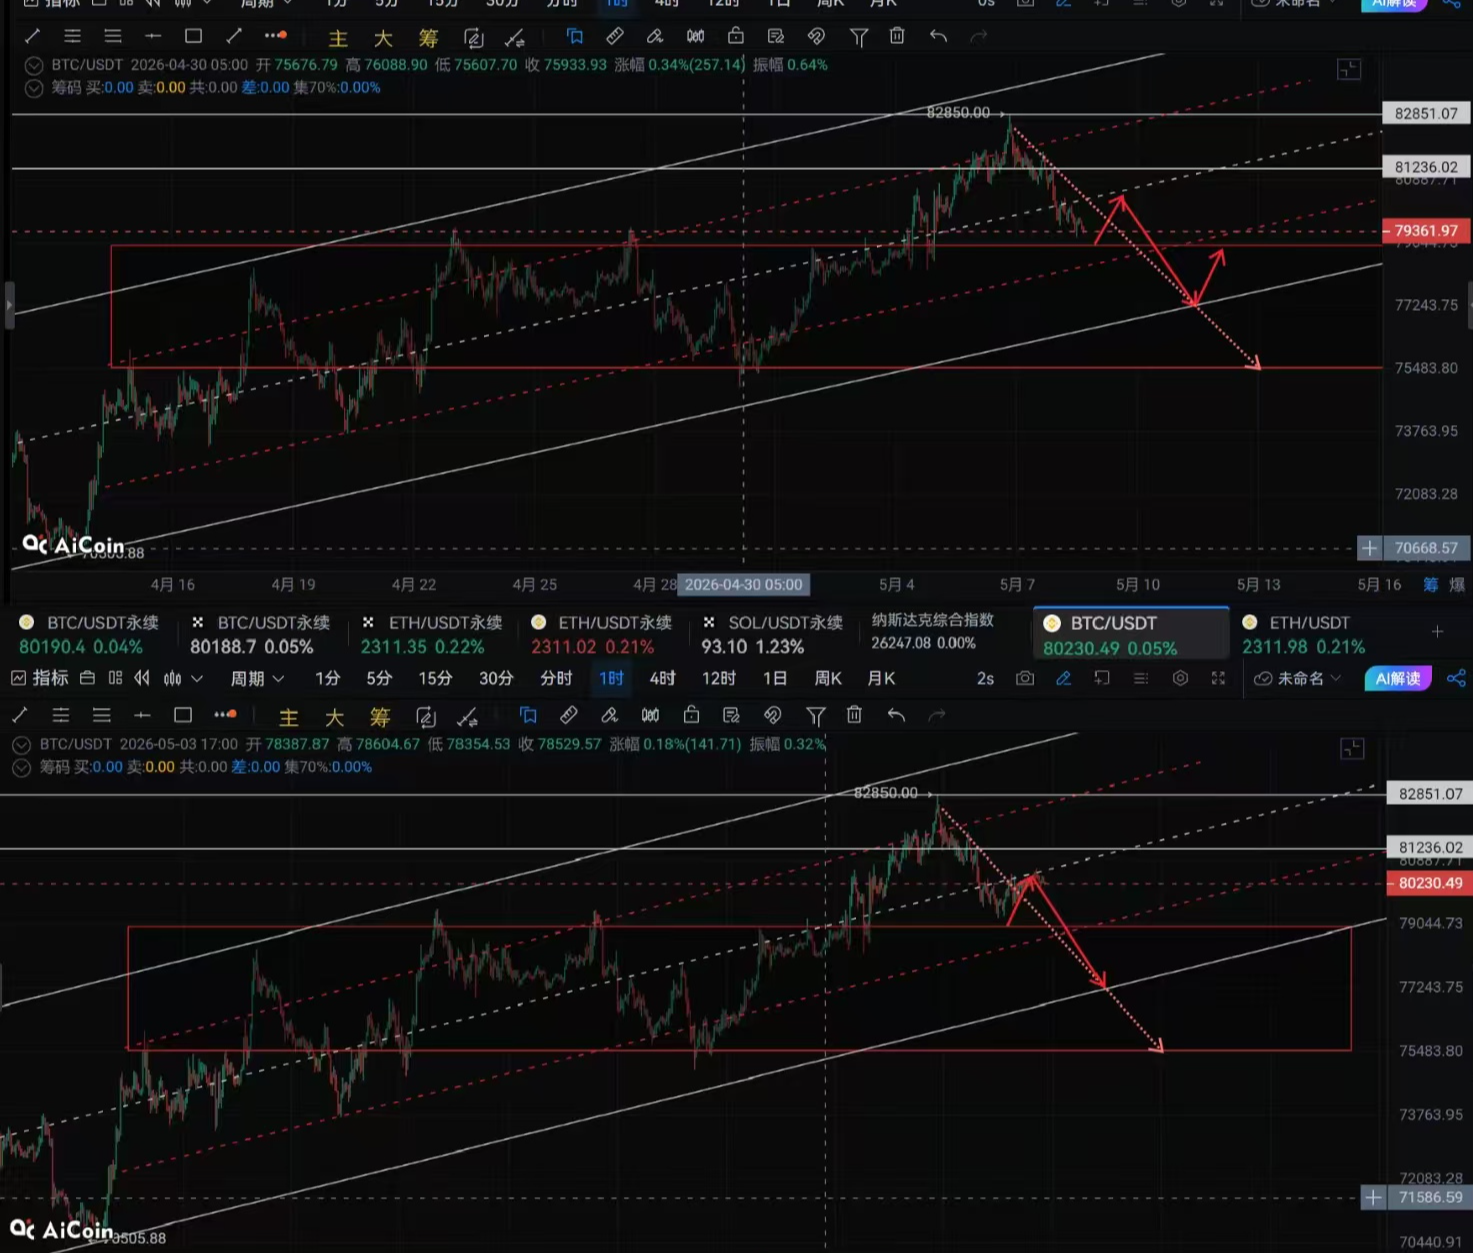
The four-hour K-line has retraced from 82800 and is currently in the oscillation range of 80000 to 81500. The EMA15 moving average is beginning to flatten, signaling a slowdown in the short-term upward trend. The MACD green bars are continuously shortening, and the fast and slow lines are about to golden cross, indicating that the short-term downward momentum is exhausted and there is a demand for a rebound. The middle track of the Bollinger Bands provides support around 80200, while the upper track is under pressure around 81500. In the short term, there is a high probability of oscillating repeatedly within this range. The breakout direction needs further confirmation. At this moment, if you have not entered, do not enter; for those already holding a position that has risen from a low point, hold on to your chips.
Short-term strategy reference: Follow the trend of the larger cycle, with small stop losses for quick in and out
For moves up from 80200 to 79700, with a stop loss at 79200 and targets set at 81500 to 82500
Currently, it is not advisable to touch the peak; only if it breaks below 79200 and confirms with a four-hour close should you consider trying to short with a light position, placing a stop loss above 80800 and targeting 78000. When going against the trend, it must be with a light position.

Friendly reminder: The above content is solely created by the author of this public account. The advertisements at the end of the article and in the comment section are not related to the author. Please discern carefully. Thank you for reading.
免责声明:本文章仅代表作者个人观点,不代表本平台的立场和观点。本文章仅供信息分享,不构成对任何人的任何投资建议。用户与作者之间的任何争议,与本平台无关。如网页中刊载的文章或图片涉及侵权,请提供相关的权利证明和身份证明发送邮件到support@aicoin.com,本平台相关工作人员将会进行核查。