TL;DR
Background: Bitcoin has once again surpassed the $80,000 mark for the first time since the end of January 2026, continuing to fluctuate around $80,000 driven by easing expectations in the US-Iran situation, new highs in US stocks, ETF capital inflow, and short covering in derivatives.
Meaning of the Breakthrough: $80,000 is a psychological threshold | $80,000 is close to the on-chain cost area | This round of Bitcoin's rebound is part of the global risk asset repricing.
Macroeconomic Environment: The US-Iran situation affects oil prices and inflation expectations | US stocks are reaching new highs, risk assets are recovering | The leadership change at the Federal Reserve brings policy uncertainty.
Market Structure: Spot ETF funds are seeing net inflows again | Institutions like Strategy are providing structural demand through buying | Derivatives leverage amplifies price volatility.
Sources of Selling Pressure: Long-term holders are taking profits, which is still increasing | A rebound from trapped funds is ongoing | Institutional buying and ETFs may turn into liquidity pressure.
Conclusion: Based on historical cycles, the current situation resembles a high-level correction rather than the early stages of a bull market. The key going forward is whether stable support can be formed above the $80,000 level, establishing a new support structure between institutional funds, on-chain costs, and macro risks.
1. Bitcoin Breaks Through $80,000: Why This Is Not Just a Normal Rebound?
On May 4, Bitcoin surpassed the $80,000 mark for the first time since January 31. This price is not a historical high and is still far from the intraday high of around $126,272 on October 6, 2025, but it signifies that the market has finally returned to the key correction area after the decline in the first quarter of 2026.
If we only look at the price itself, $80,000 seems like just a round number. However, from a market structure perspective, it corresponds to three layers of meaning.
$80,000 is a psychological threshold: After reaching historic highs in the fourth quarter of 2025, the market experienced a rapid pullback in early 2026, dropping to about $60,074 on February 6. This means that the market experienced a decline of over 50% from the peak to the trough. Returning to $80,000 indicates that BTC has recovered about 30% from the low in February, and the market's judgment on whether "the trend is over" is starting to loosen.
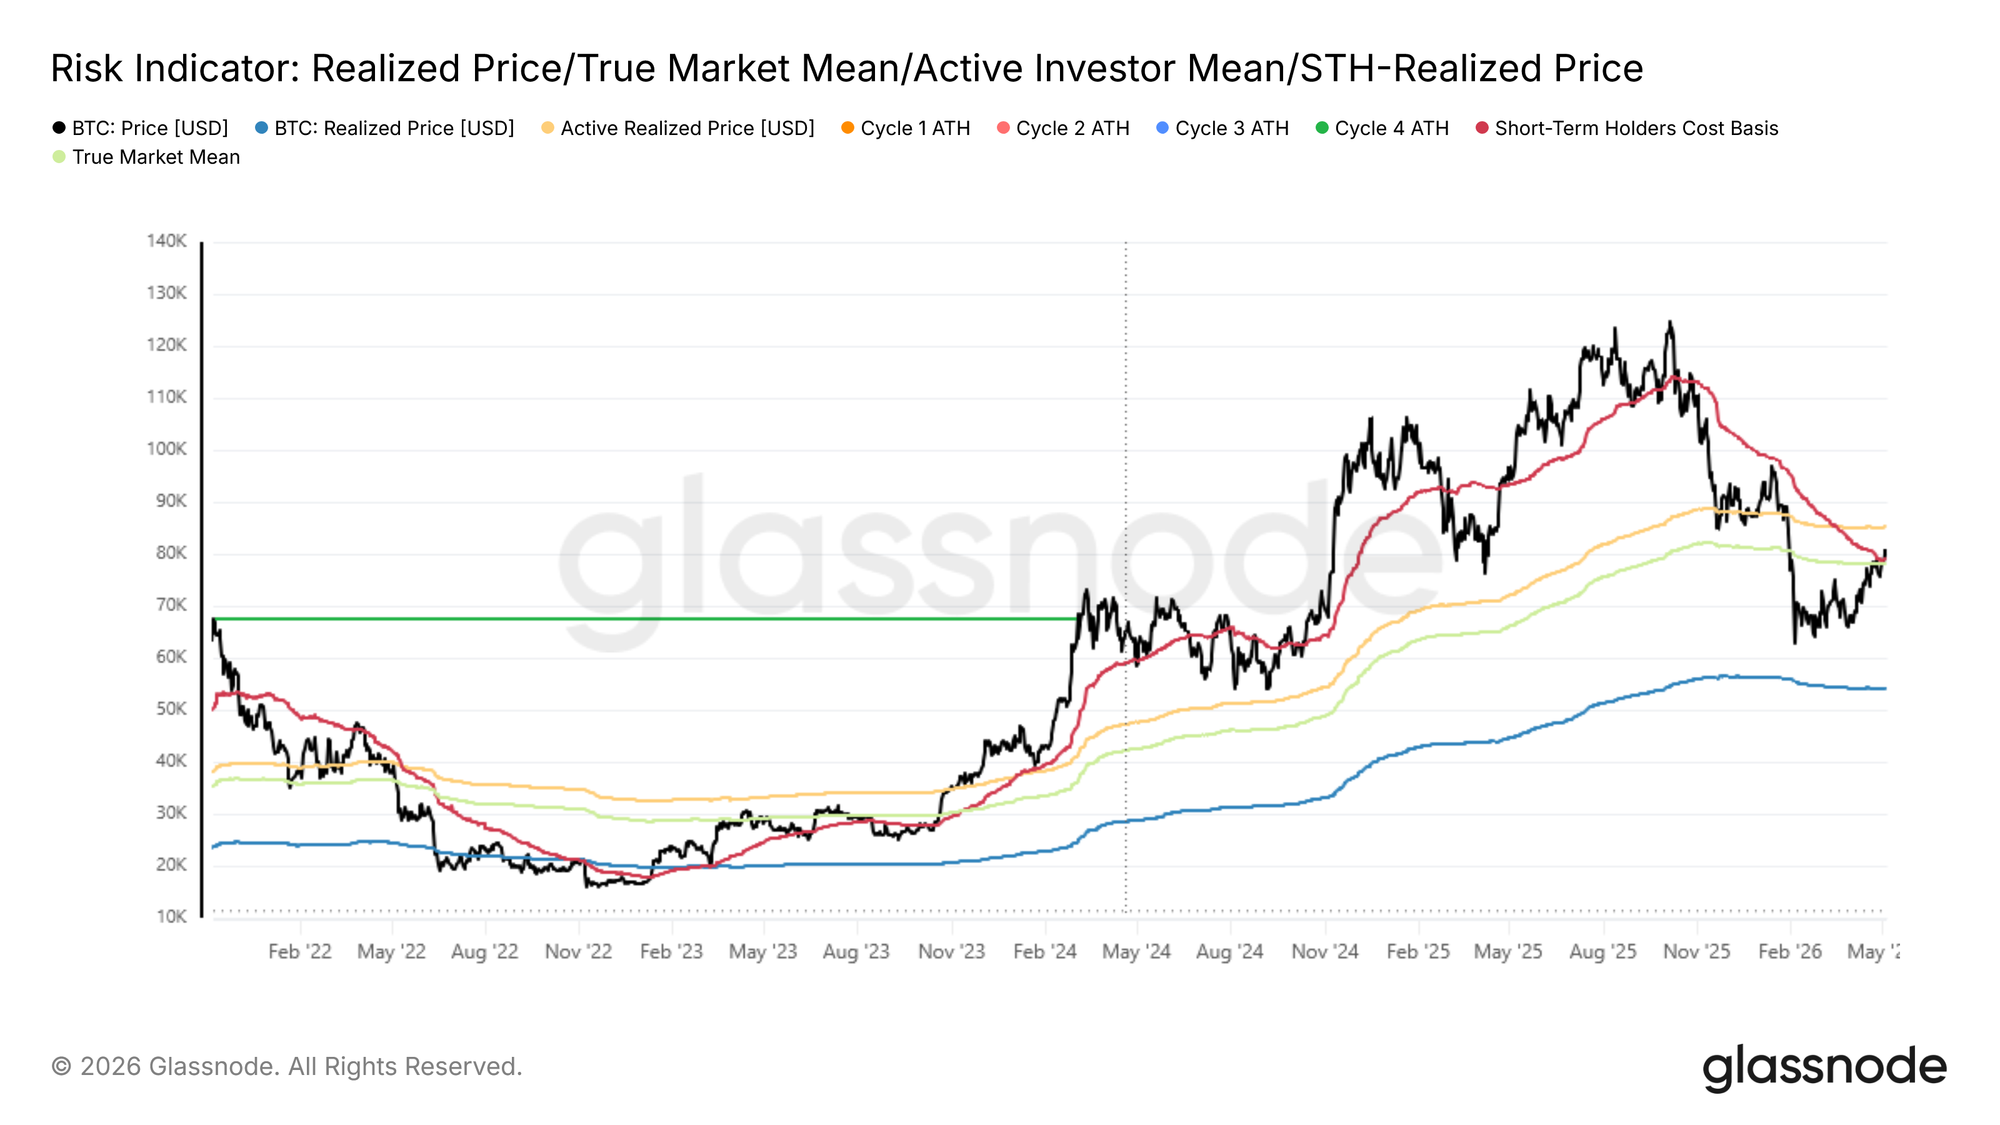
$80,000 is close to the on-chain cost area: According to a report by Glassnode, the real market average price of BTC (TMMP) is about $78,200, and the cost line for short-term holders is around $79,100. These two indicators represent the average cost area of actively circulating supply and buyers over the past 155 days. Once the price can remain above these levels, it indicates that the short-term capital pressure that was previously trapped is starting to ease, and the market is switching from a "deep value area" to a "repair confirmation area."
Result of Macro Risk Appetite Reassessment: This round of Bitcoin's rebound is not driven by a single cryptocurrency narrative but is the result of expectations of easing US-Iran tensions, new highs in US stocks, ETF capital inflow, and short covering in derivatives. In other words, BTC's return to $80,000 is not an isolated event but part of the global risk asset repricing.
Therefore, Bitcoin breaking through $80,000 is a test of market repricing. It tests whether institutional funds are willing to continue buying, whether the macro environment continues to support risk assets, whether on-chain selling pressure can be absorbed, and whether similar phases in historical cycles can transform into trend continuation.
2. Macroeconomic Environment: US-Iran Situation, Federal Reserve Leadership Change, and Risk Asset Repricing
1. Easing of US-Iran Situation: The Triple Transmission of Oil Prices, Inflation, and Risk Appetite
One of the most important external variables affecting risk assets recently is the US-Iran situation and the Strait of Hormuz issue. On May 5, 2026, US President Trump announced the suspension of a ship escort operation called the "Freedom Plan" in the Strait of Hormuz to allow space for reaching an agreement with Iran, but the US blockade of Iranian ports continues. Media outlets such as AP and Al Jazeera mentioned that the relevant actions are closely related to ceasefire, negotiations, and the resumption of shipping in the strait.
The impact of this variable on Bitcoin is not one-dimensional. In the short term, if the market believes that the US-Iran conflict is easing, causing oil prices to fall, inflation pressure to reduce, and risk appetite to decline, it is easier for risk assets to rise. Currently, Brent crude oil has fallen from around $114 to approximately $98.5, with eased energy pressures helping US stocks maintain high levels.
However, in the medium to long term, the US-Iran situation remains a source of volatility. If tensions in the Strait of Hormuz escalate again, oil prices might rise, leading energy prices to influence risk assets through inflation expectations, US Treasury yields, and consumer spending pressures. For Bitcoin, this means two completely different trading paths: on one hand, it may be perceived by some funds as a non-sovereign asset under geopolitical risk; on the other hand, it may be viewed by larger institutional funds as a high-beta risk asset, facing selling pressure as the dollar, US Treasury yields, and oil prices rise. Bitcoin's performance in this round concerning the US-Iran situation is closer to the latter. It is not simply a "safe-haven asset" but has been reintegrated into upward trading of risk assets against a backdrop of falling oil prices, strong tech stocks, and resuming ETF inflows.
2. US Stocks Reach New Highs: Risk Appetite Recovery Provides External Support for BTC
An important backdrop for BTC's return to $80,000 is that US stocks have not significantly weakened due to geopolitical pressures; instead, they continue to reach new highs driven by AI, semiconductors, and corporate earnings. Companies like AMD exceeded expectations, strengthening market confidence in the AI infrastructure cycle. On May 1, the S&P 500 closed at 7,230.12 points, and Nasdaq closed at 25,114.44 points, both setting new closing highs and recording a sixth consecutive week of gains.
Previously, the market was concerned about whether Bitcoin had already transitioned from being a high-period asset to a target of passive selling amid liquidity retreat. But when US stocks hit new highs, semiconductors rose, and Asian stock markets approached historical highs, institutional investors find it easier to reallocate high-beta assets. Bitcoin's return to $80,000 is not just a self-repair of the cryptocurrency market but is evidence of a resurgence of risk appetite.
However, if US stocks switch from "earnings-driven growth" to "valuation overheating adjustment," BTC may also face downward pressure. Especially in the case where there are discussions of overheating in the semiconductor and AI sectors, Bitcoin's subsequent rise cannot rely solely on external risk appetite but requires a more stable spot demand and confirmation of on-chain structure.
3. Federal Reserve Leadership Change: Policy Expectation Window is Not a One-Sided Benefit
Another macro variable is the leadership change at the Federal Reserve. Powell's chairmanship will end in mid-May 2026. Currently, Kevin Warsh has passed the Senate Banking Committee process and is awaiting further voting; Powell stated he would remain on the Federal Reserve Board after his term ends, with a term that could extend to 2028.
Warsh is seen by the market as a candidate who may be closer to Trump administration policy preferences, but his policy path does not necessarily equate to an immediate rate cut. Barron's analysis of Warsh's policy framework indicates he might choose to maintain interest rates before summer, waiting for energy prices and inflation paths to be clearer while adjusting the Fed's communication methods and inflation measurement framework. The impact of the Fed leadership change on BTC has three layers:
Increased policy uncertainty. The market needs to reprice the Fed's independence, inflation tolerance, rate cut pace, and balance sheet path.
Short-term may be beneficial for risk assets. If the market believes Warsh is more likely to push for easing in the second half of the year, BTC, tech stocks, and high-beta assets would begin to reflect liquidity expectations.
If inflation rises again due to oil prices or tariffs, the leadership change may lead to more complex policy conflicts. At this point, Bitcoin will face tugging between "rate cut expectations" and "inflation pressures."
Therefore, before mid-May, Bitcoin's breakthrough above $80,000 is still within a policy verification window. It needs to wait for the new Federal Reserve chairman's confirmation, expectations from the June FOMC meeting, and direction from energy prices and inflation data.
3. Market Structure: Institutional Buying, ETF Inflows, and Amplified Leverage
1. ETF Inflows Become the Core of Spot Buying Again
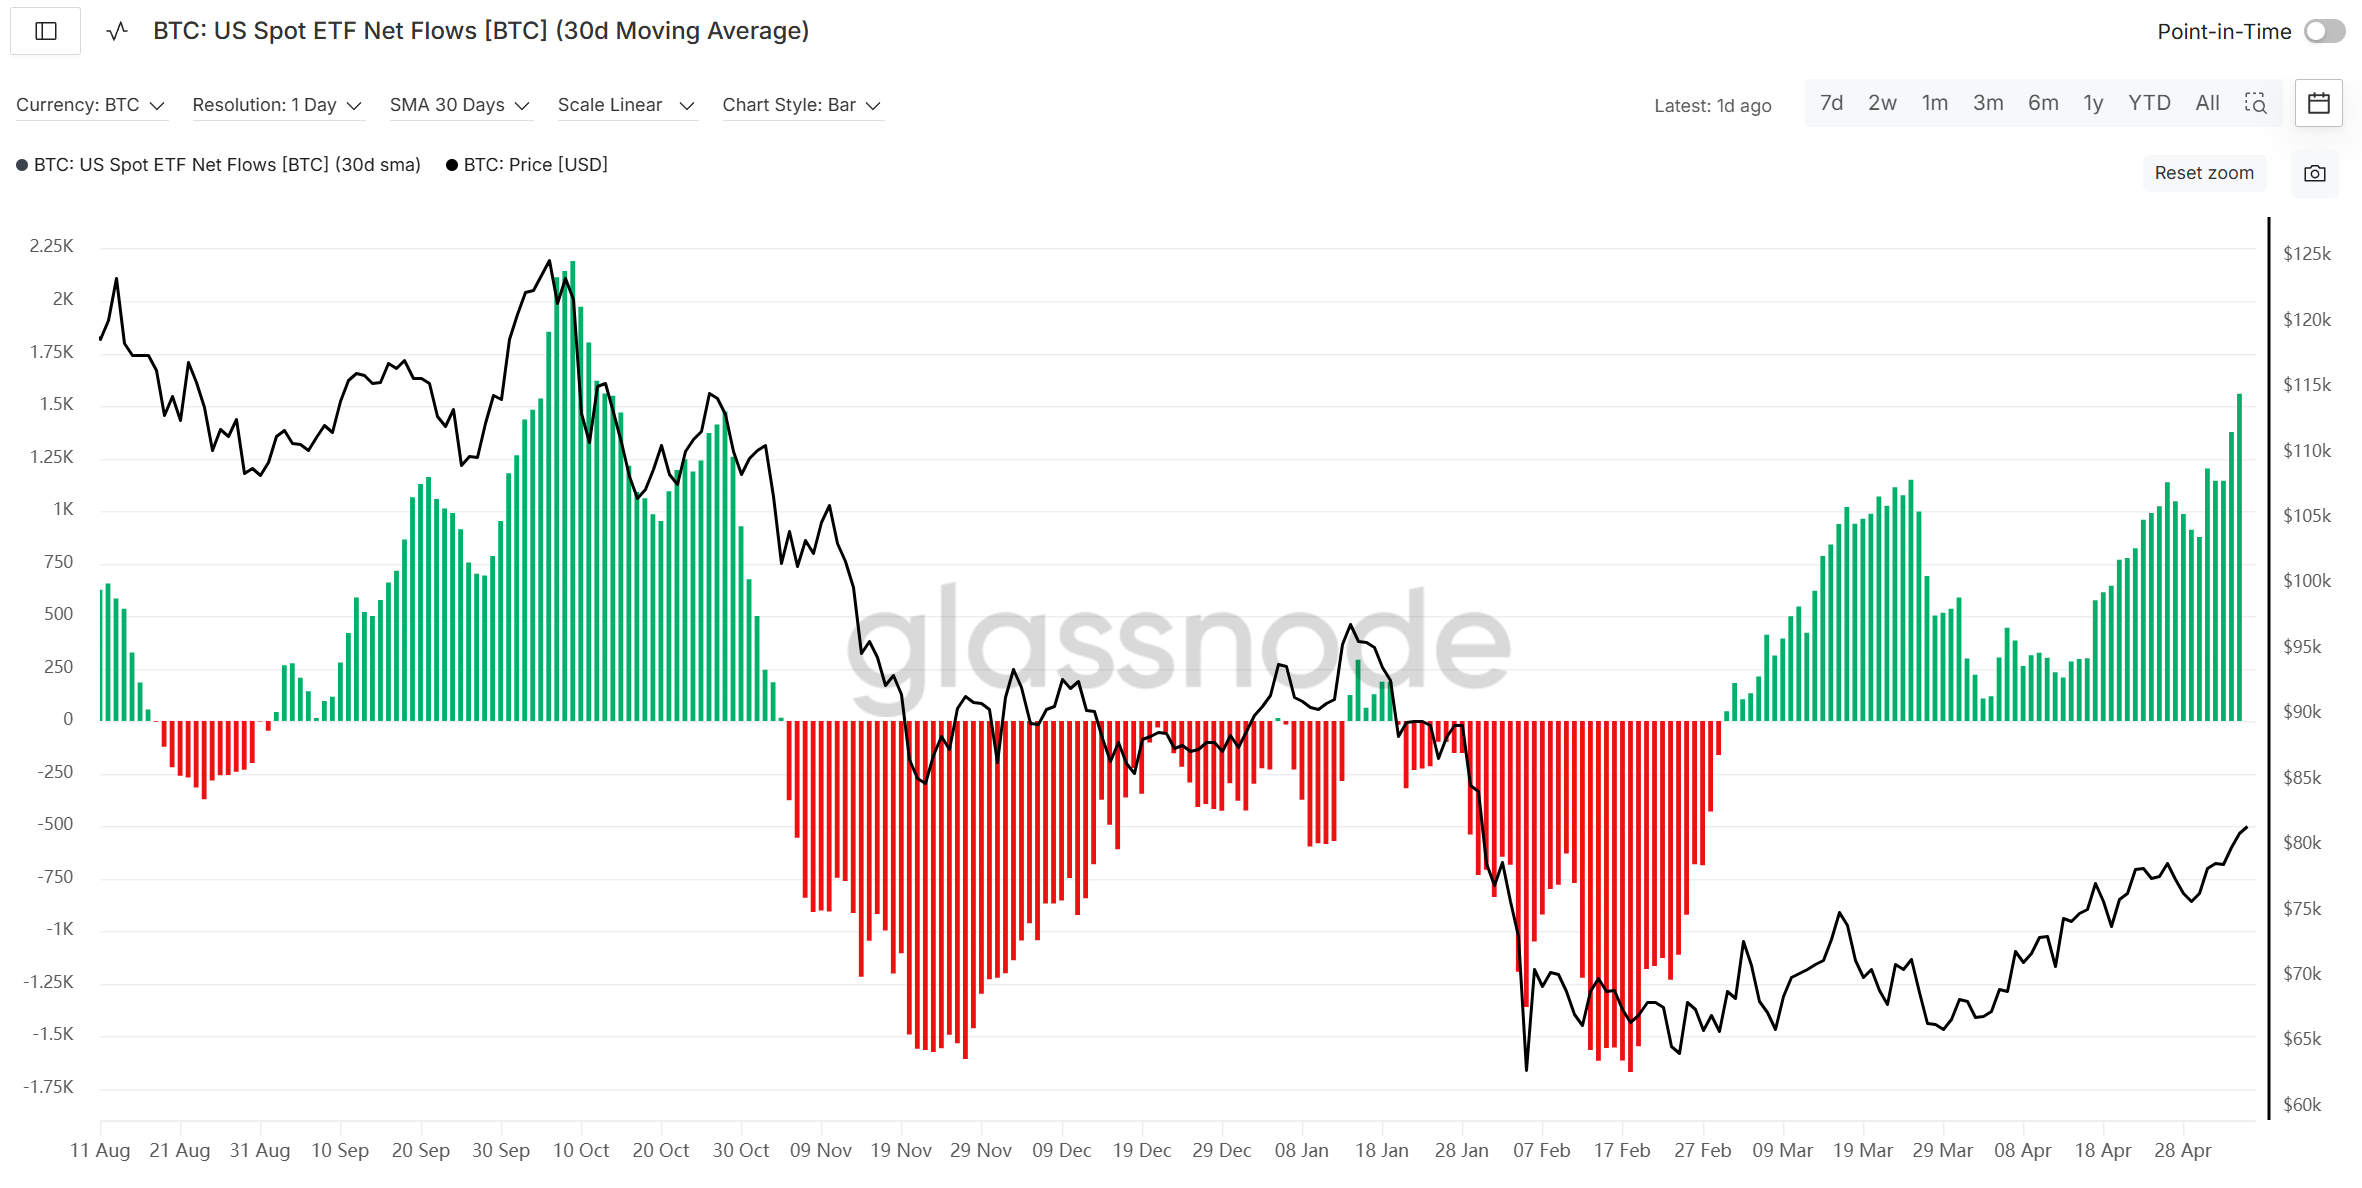
Source: https://studio.glassnode.com/charts/institutions.UsSpotEtfFlowsNet
Unlike the cycles of 2017 and 2021, the biggest structural change in Bitcoin's market in 2026 is that spot ETFs have become the main channel for institutional funds to enter BTC. According to Glassnode statistics, US spot Bitcoin ETFs recorded about $2.44 billion in net inflow in April 2026, marking one of the strongest monthly performances of the year, with strong inflows continuing in early May. It can be seen that ETF capital has clearly reversed from outflows in the first quarter.
This explains why the breakthrough of $80,000 looks more like institutional capital inflow rather than retail FOMO. ETF buying has several characteristics: it is more stable, more transparent, more influenced by macro risk appetite, and is more likely to form a positive feedback loop of "price rise - capital inflow - further price rise." However, it also has vulnerabilities: if US stocks adjust, Fed expectations turn hawkish, or BTC drops back to key cost areas, ETF capital may revert to redemptions. Therefore, ETF inflows are the core support for this breakout, and whether they can continue is the first variable in determining if $80,000 can turn from a pressure point into a support level.
2. Institutional Buying Provides Structural Demand and Also Creates New Risks
In addition to ETFs, buybacks from listed companies and institutional treasury remain an important source of BTC demand. Strategy’s financial report released on May 5 indicates that its holdings have increased to 818,334 BTC, with a growth of 22% year-to-date, with an average cost of about $75,537. Meanwhile, the company has raised approximately $11.68 billion through the capital market year-to-date. Such buying has a significant supporting effect on the market. The holdings of Strategy account for about 3.9% of the total Bitcoin supply, and its continued purchases reinforce the narrative of "assetization of institutional treasuries," also providing long-term demand expectations for the secondary market.
However, this structure also carries risks. Strategy is no longer merely a company buying BTC but is building a complex capital structure through common stocks, preferred stocks, convertible bonds, and so on. The financial report shows that the company recorded nearly $14.5 billion in unrealized losses on digital assets in Q1 due to declines in BTC’s fair value. This does not mean Strategy will become a major selling pressure in the short term, but it highlights that the institutionalization of the Bitcoin market is not solely positive. Institutional buying provides structural demand while binding BTC more tightly to traditional capital market volatility, financing costs, and balance sheet management.
3. Derivatives Drive Breakthroughs, but Also Amplify Rebound Risks
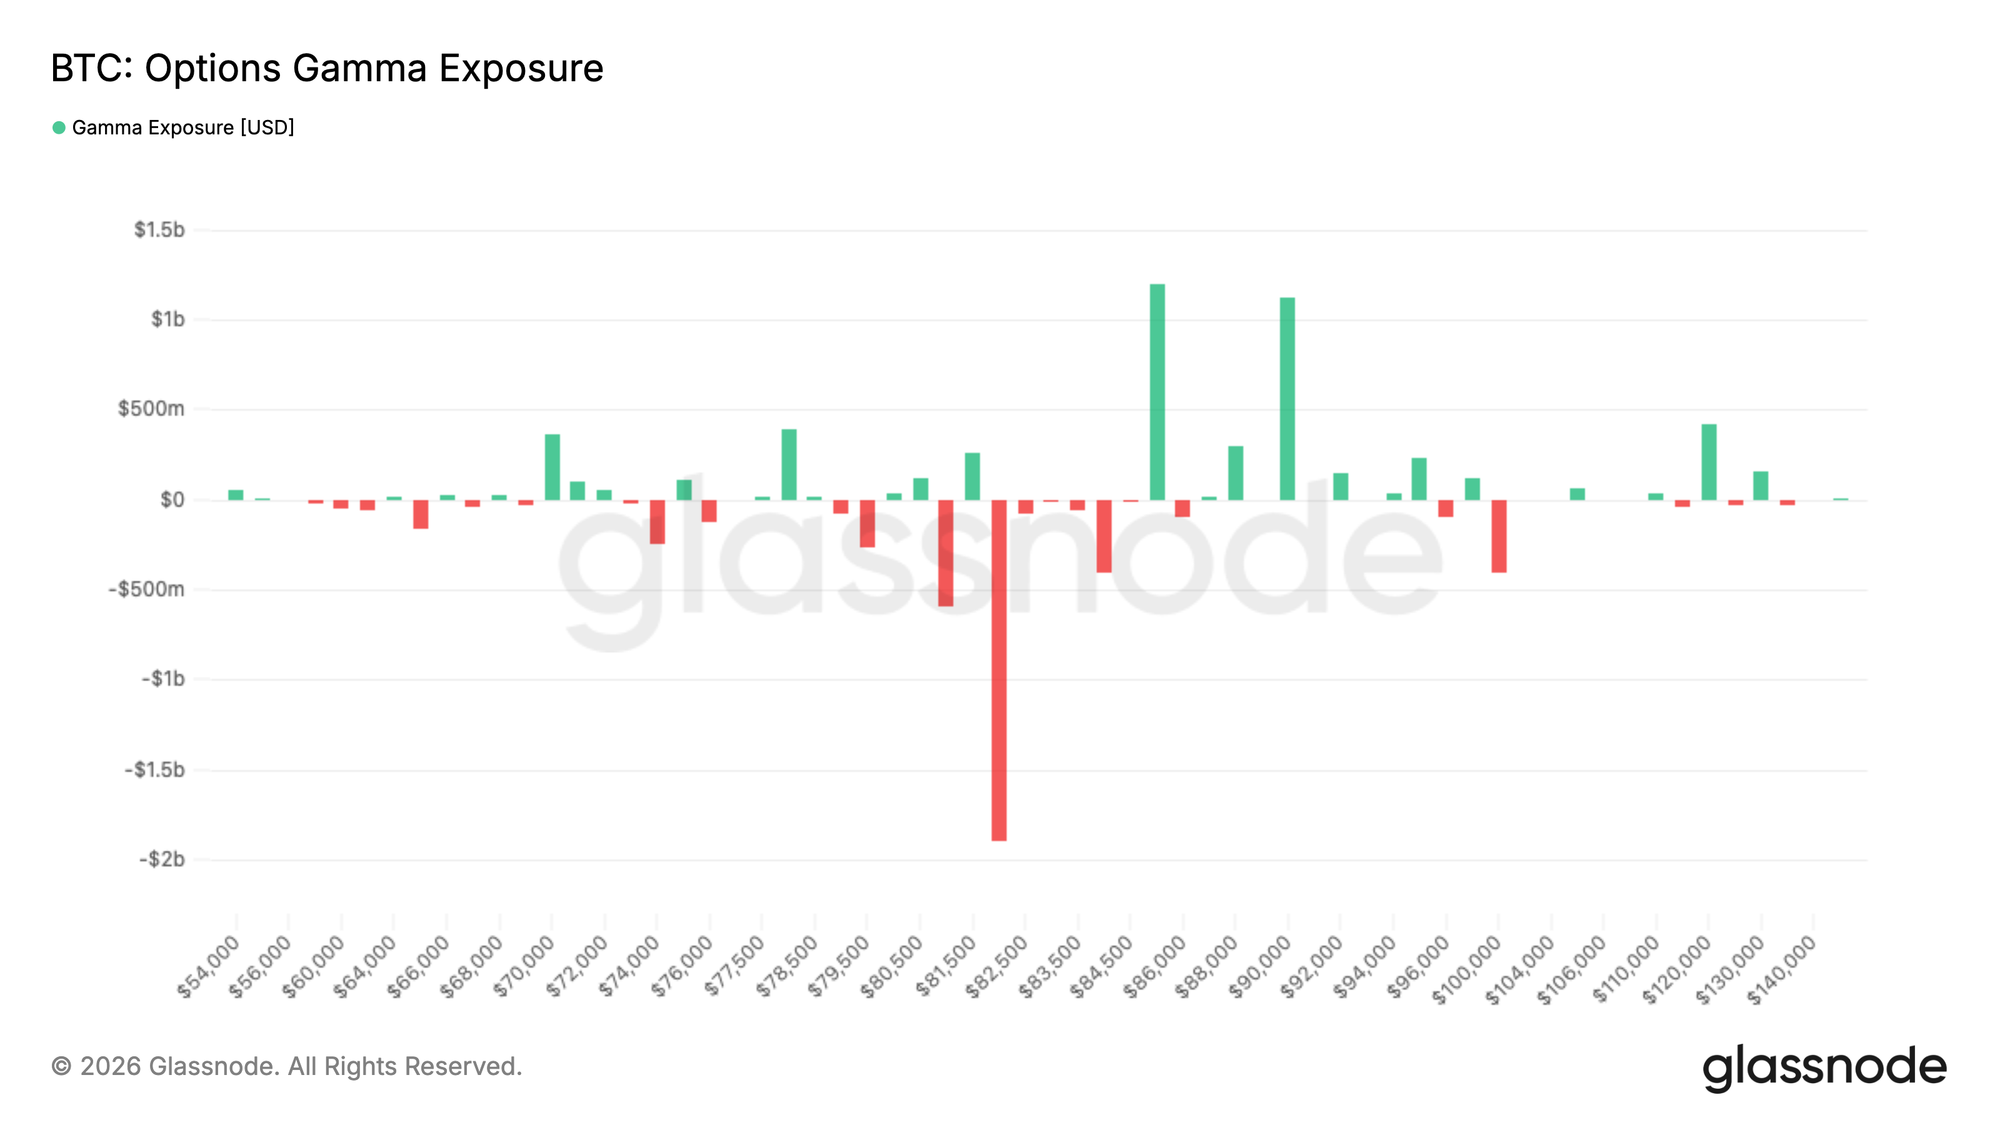
Source: https://insights.glassnode.com/the-week-onchain-week-18-2026/
An important feature of the current breakthrough at $80,000 is the high participation of derivatives markets. The funding rates of perpetual contracts have been predominantly negative during this price rebound, indicating that there are still significant short positions in the market; such a structure is prone to short covering when prices break through key thresholds.
The options market is also amplifying volatility. Glassnode data shows there is a concentration of about $2 billion in short gamma around the $82,000 level. Short gamma means that market makers need to buy to hedge when prices rise and sell to hedge when prices fall, thus amplifying directional price movement. This explains why BTC might see rapid surges around the $80,000 level but might also rapidly decline if it fails to hold that level.
In summary, among the sources of buying pressure for the breakthrough at $80,000: ETFs represent relatively stable spot demand, institutional treasuries provide structural demand, while derivative short covering and gamma trading act more like volatility amplifiers. If future rises depend mainly on ETFs and spot absorption support, prices are more likely to hold firm; if rises mainly rely on leverage and short covering, the area above $80,000 may become a quick test rather than trend continuation.
4. Sources of Selling Pressure: Where is the Real Pressure Above $80,000?
The real market average price of BTC and the cost for short-term holders constituted upper pressure previously, but after the breakthrough, they theoretically should convert into support. If BTC can remain above the $78,200–$79,100 range for several days in the future, it would indicate that the deep value phase since February may have come to an end.
However, this does not mean that selling pressure has disappeared. The next key resistance point is around $85,200, reflecting the Active Realized Price. This indicator represents the cost basis of non-hibernating supply and the broader average holding price of active market participants. In other words, $80,000 is just the first threshold, while $84,000–$85,000 is the key area to test whether the market can truly transition into trend continuation.
1. Long-term Holders Taking Profits: The Scale is Not Extreme, but is Rising
Source: https://insights.glassnode.com/the-week-onchain-week-18-2026/
The first type of selling pressure comes from long-term holders. Glassnode data shows that the 14-day average of realized profits from supplies held for over a year has risen to about $180 million per day. This indicates that as prices approach above $80,000, early low-cost funds are beginning to cash out some of their gains.
It is normal for long-term holders to gradually distribute their chips in a bull market, and the key is whether buyer liquidity can absorb it. If ETF inflows, institutional allocations, and spot buying can cover the $100–200 million daily selling from long-term holders, prices can continue to rise steadily; if ETF inflows slow down while long-term holders' selling pressure continues to increase, the area around $85,000 may become a temporary top.
2. Realized Losses Remain High: Trapped Funds Are Still Trying to Exit
The second type of selling pressure comes from loss accounts. Glassnode data shows that the 14-day average of total Realized Loss is around $479 million per day, which is about 140% higher than the benchmark of around $200 million per day during stable periods. This indicates that even though prices have rebounded from a low of $60,000, many investors still choose to exit once their losses narrow.
This type of selling pressure is more sensitive to market movements. Long-term holders selling is usually profit distribution, occurring at a relatively slow pace; loss accounts escaping tend to concentrate more when prices face resistance. If BTC fails to break through the $84,000–$85,000 area, short-term buyers and trapped high-positioned funds may choose to sell again, leading to prices retracing to the $78,000–$80,000 cost area.
3. Institutional Buying and ETF Redemption Risks: Potential for Liquidity Pressure
The third potential selling pressure comes from cash flows themselves. If ETFs continue to inflow, the market can absorb new supplies from miners, selling from long-term holders, and escaping loss accounts. But if ETFs shift from inflow to outflow, the previously structural support may become a reverse pressure.
Currently, ETFs have become an important channel for Bitcoin price discovery. In April, an influx of about $2–$2.4 billion supported the rebound, but historical experience shows that ETF funds are highly sensitive to macro environments. When US stocks correct, the dollar strengthens, oil prices drive inflation expectations up or Fed leadership change expectations turn hawkish, ETF capital may quickly contract. At that time, Bitcoin will face not only on-chain selling pressure but also re-balancing selling pressure from traditional capital channels.
5. Historical Cycle Comparison and Subsequent Trend Projection
1. Historical Cycle Comparison: The Current Situation Resembles a High-Level Correction Rather Than the Early Stages of a Bull Market
In Bitcoin's historical cycles, a 20%–40% correction after a high is not uncommon. In the 2017 cycle, BTC experienced around 30% corrections several times, but as long as prices were able to remain above key moving averages and cost areas, the trend often continued to extend. The 2021 cycle was more complex, with Bitcoin rapidly declining in the first half of the year before experiencing a secondary surge in the second half, ultimately forming a double top structure. What truly determines the nature of the market is not a single day's breakthrough at a certain integer threshold, but whether prices can maintain stability in the cost area while holding demand amid the release of supply pressure above.
The current phase of 2026 is similar to historical cycles in that Bitcoin still exhibits typical cyclical asset characteristics: sharp corrections at high levels, panic capital fleeing, struggles for cost areas, long-term holders gradually distributing, and short-term holders' cost line becoming the dividing line between bulls and bears. The rebound from around $60,000 to $80,000 in February is essentially a repricing repair within a high-level cycle.
The difference lies in the fact that ETFs and institutional funds have changed the supply and demand structure. In 2017, the market was primarily driven by retail and exchange funds, while the presence of institutional and publicly-listed company allocations began in 2021, but spot ETFs had not yet become the main funding channel. The market in 2026 is different: ETF funds, institutional treasury, options gamma, and capital instruments from publicly-listed companies collectively influence BTC prices. The supply and demand structure is more mature but also more financialized.
This means that one cannot simply apply frameworks like "post-halving must rise" or "certain phases of historical cycles must create new highs." The current situation resembles a "reallocation phase for institutions after a high-level correction." If ETF inflows continue, on-chain loss accounts compress, and the $85,200 resistance is broken, the market might transition from repair to trend continuation; if macro risks rise again, ETF inflows slow, and the selling pressure at $85,000 cannot be absorbed, then the breakthrough above $80,000 may just be a mid-term rebound.
2. Subsequent Trend Projection: What Comes After $80,000?
(1) Optimistic Scenario: Firmly Standing at $80,000, Breaking Through $85,000, and Retesting $90,000
In an optimistic scenario, Bitcoin needs to meet three conditions.
First, prices must consistently maintain above the $78,200–$79,100 cost range, allowing True Market Mean and short-term holder cost lines to shift from pressure to support. Second, ETF funds need to continue net inflows, with daily purchases sufficient to cover the profit distribution of long-term holders at about $180 million per day and loss accounts escaping. Third, prices need to effectively overcome the $85,200 Active Realized Price range, maintaining several days of closing above this range.
If these three conditions are met, $80,000 will shift from a psychological threshold to medium-term support, potentially leading the market to test the $90,000 range further. At that time, the narrative for the market will also transition from "rebound after a drop" to "continuation of the high-level cycle."
(2) Neutral Scenario: Fluctuations Between $78,000 and $85,000, Awaiting Macro Variables to Settle
The neutral scenario aligns more with the current state of the market. BTC has regained institutional support but still faces high realized losses on-chain, increasing distributions from long-term holders, and uncertainty regarding the Fed's leadership change. In this context, prices might fluctuate repeatedly in the $78,000–$85,000 range.
This range of fluctuations may not necessarily be a bad thing. It can allow for short-term profit-taking, clearing loss accounts, continued absorption of supply by ETF funds, and awaiting further clarity on the US-Iran situation, oil prices, Warsh's path to take office, and June FOMC expectations. If during the fluctuation, the Realized Loss compresses from $479 million per day and ETF inflows remain positive, then a period of sideways movement could actually lay the groundwork for the next breakout.
(3) Risk Scenario: Falling Back Below $78,000, Retesting $72,000–$75,000
In a risk scenario, the market may face several triggering factors.
First, US-Iran negotiations falter, tensions in the Strait of Hormuz escalate, oil prices rise again, and inflation expectations revive. Second, US stocks correct due to overheating valuations in AI or semiconductors, prompting synchronized deleveraging in risk assets. Third, after Warsh takes office, the market may realize that rate cuts won't come quickly, causing liquidity expectations to be dashed. Fourth, ETF inflows slow down or even turn into redemptions. Fifth, if BTC fails to break through $85,000, short-term funds might choose to sell during rebounds, keeping Realized Loss high.
If prices fall below the $78,200–$79,100 range, it suggests that this breakthrough failed to convert the cost area into support, and the market may re-test the $75,000 or even $72,000 range. In extreme scenarios, if both US stocks and oil prices apply pressure to risk assets, Bitcoin may not rule out revisiting support near $70,000.
3. Conclusion: $80,000 is Not the Endpoint, but the Starting Point of a Repricing Test
Bitcoin's return to $80,000 is an important signal but not the final answer. It signifies that the market has repaired from the fears since the low in February, with ETF and institutional funds flowing back, on-chain cost areas being reclaimed, and improved risk appetite from new highs in US stocks and easing expectations regarding the US-Iran situation. However, it also indicates that the market is entering a more critical verification phase.
From a deeper perspective, the current Bitcoin market is transitioning from a "high-volatility narrative asset" to an "institutional risk asset." This means its upward logic is maturing but is also more influenced by macroeconomic factors, stock markets, interest rate expectations, and cash flows. The $80,000 level is not a bull market confirmation point but a repricing test zone. What the market needs to prove next is whether Bitcoin can establish a new support structure among institutional funds, on-chain costs, and macro risks.
Therefore, in the short term, whether Bitcoin can remain above $80,000 and break through $85,200 is key in assessing the quality of this rebound; in the medium term, whether ETF inflows continue, whether Realized Loss compresses, and whether the selling pressure from long-term holders can be absorbed will determine if BTC enters trend continuation or returns to broad fluctuations. For investors, what truly needs to be focused on is not the daily price breakthrough but whether the quality of the funds behind this breakthrough, the structure of selling pressure, and the macro pricing environment have genuinely improved.
About Us
Hotcoin Research, as the core research institution of Hotcoin Exchange, is dedicated to transforming professional analysis into your practical tool. Through our "Weekly Insights" and "In-Depth Reports," we analyze market trends for you; leveraging our exclusive column "Hotcoin Selection" (AI + Expert Dual Screening), we help you identify potential assets and reduce trial-and-error costs. Each week, our researchers also engage face-to-face with you through live broadcasts to interpret hotspots and predict trends. We believe that warm companionship and professional guidance can help more investors navigate cycles and seize value opportunities in Web3.
Risk Warning
The cryptocurrency market is highly volatile, and investing inherently carries risks. We strongly recommend investors engage in investment under a strict risk management framework while fully understanding these risks to ensure the safety of their funds.
Website: https://www.hotcoin.com/zh_CN/learn/index/
免责声明:本文章仅代表作者个人观点,不代表本平台的立场和观点。本文章仅供信息分享,不构成对任何人的任何投资建议。用户与作者之间的任何争议,与本平台无关。如网页中刊载的文章或图片涉及侵权,请提供相关的权利证明和身份证明发送邮件到support@aicoin.com,本平台相关工作人员将会进行核查。