Dear friends, I am Sister Qinglan. This morning, the market was dominated by two significant pieces of news. One is that a U.S. court ruled Trump's 10% global tariffs invalid, which the market interpreted as a strong positive, directly lowering inflation expectations and providing support for risk assets including Bitcoin. The other is the escalation of geopolitical conflicts, with U.S. and Iran exchanging fire in the Strait of Hormuz, raising short-term safe-haven sentiments that may weigh on the crypto market. One good one bad, market sentiment is mired in confusion, but overall, the benefit from the tariff cancellation leans more towards the fundamentals while the impact of geopolitical conflict is often pulse-like. We need to use data to verify the current state of BTC.
Current Price and Time
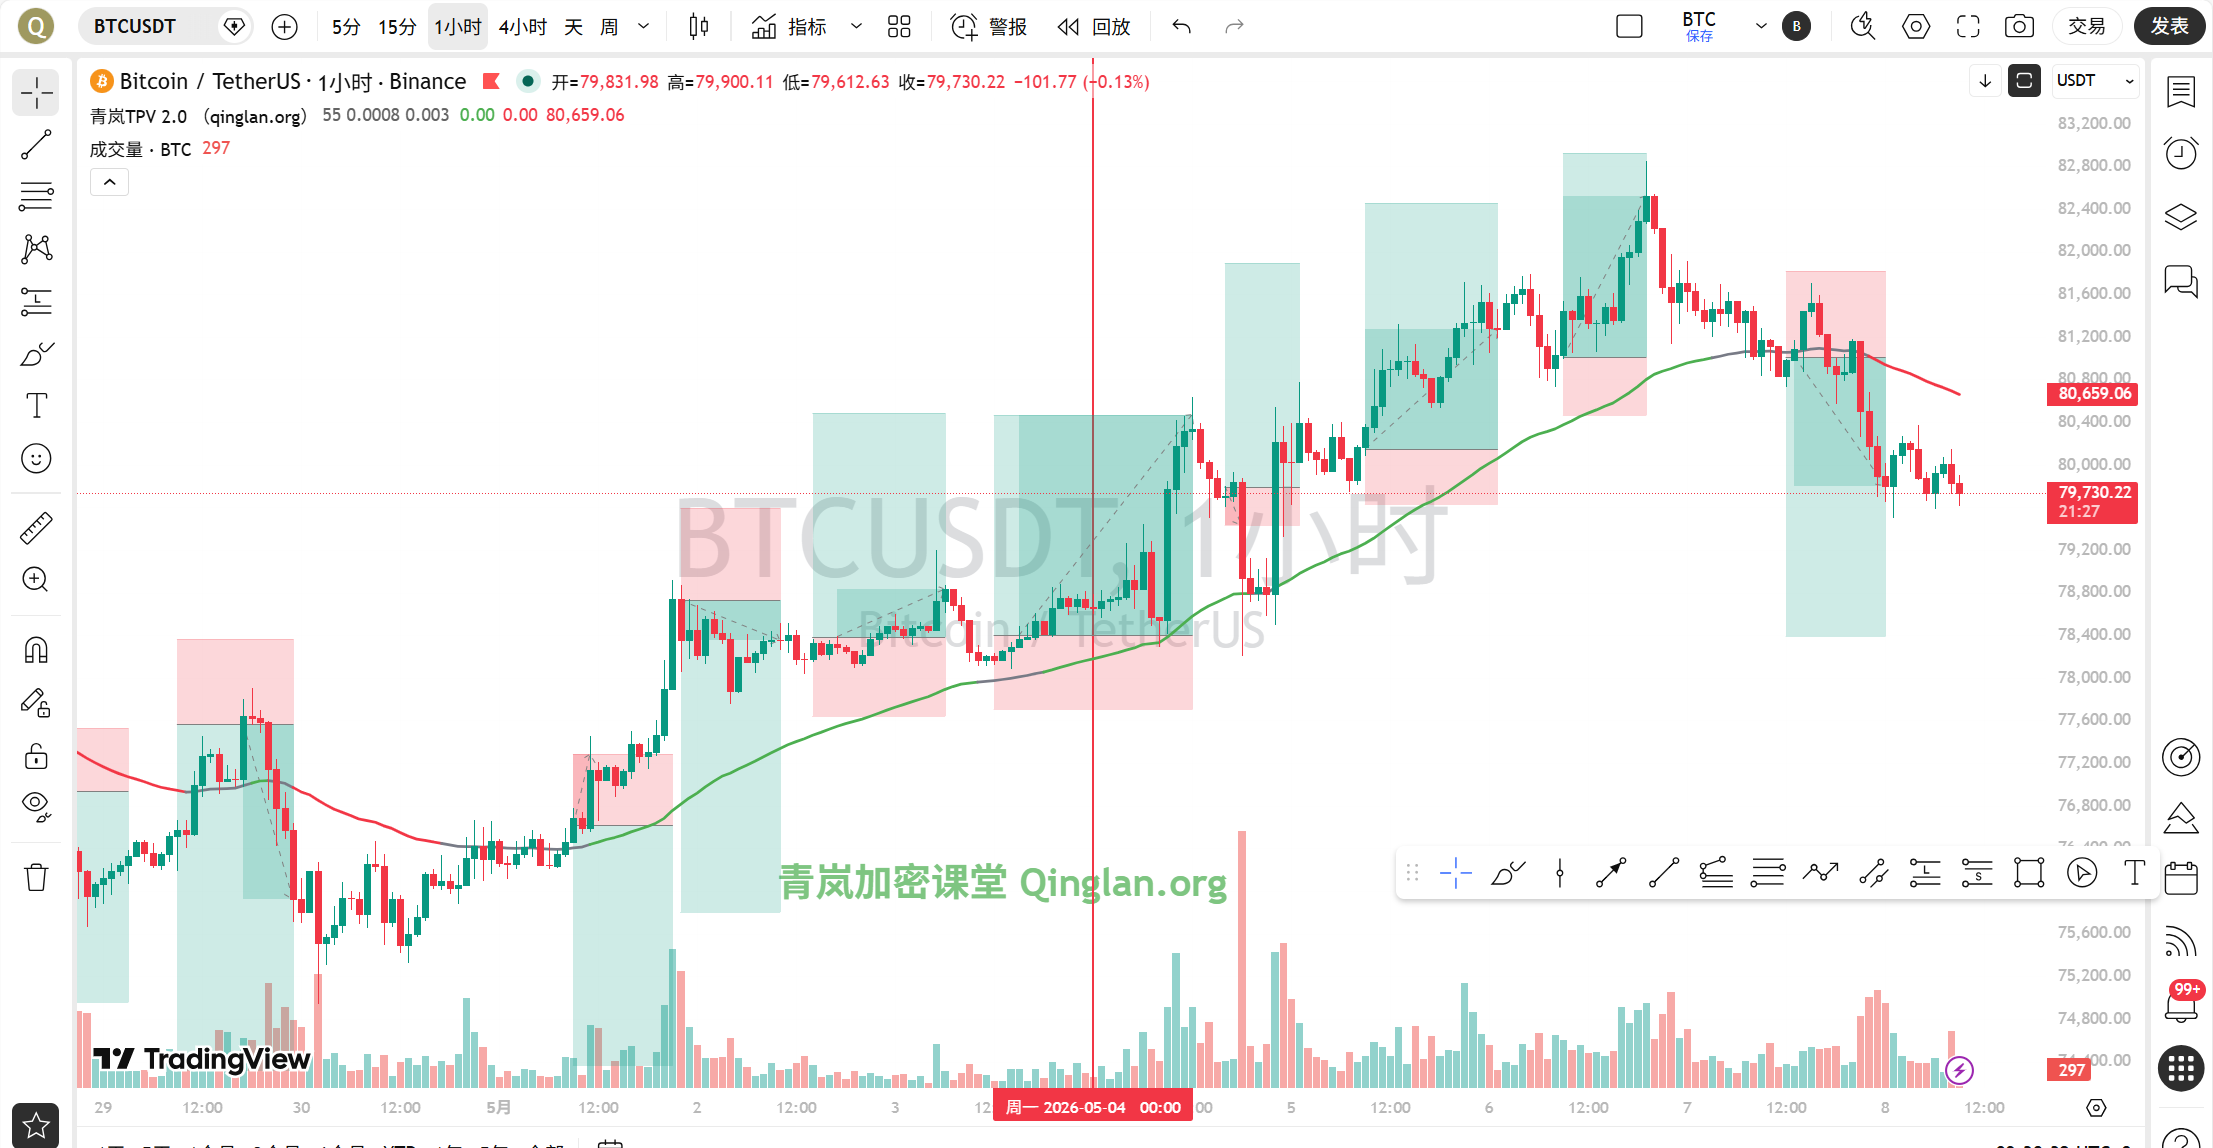
The current time is May 8, 09:37, and the latest BTC quote is 79698 USDT, with a 24-hour decline of 1.77%. The price hovers below the 80,000 mark, and market sentiment is cautious.
Multi-Cycle Status Overview
Let's first look at the daily line. At the daily level, MA5 is at 80383, MA10 is at 78953, and MA30 is at 76639, with the moving average system showing a bullish arrangement, but MA5 has already flattened. In terms of MACD, DIF is 1858, DEA is 1823, and the histogram is at 34.62; although it is still positive, the histogram is shortening, indicating a decline in bullish momentum. RSI is 59.62, in the neutral to strong area, but has not yet entered overbought territory. Overall, the daily line is still in a bullish trend, but the pace of the rise is slowing down.
At the 4-hour level, the situation is more subtle. MA5 is at 80121, MA10 is at 80757, and MA30 is at 80386; the moving averages are starting to intertwine, and MA5 has crossed below MA10. MACD’s DIF is 213, DEA is 533, and the histogram is -319.45, having formed a death cross and continuing to diverge, with bearish momentum being released. RSI is 37.22, entering a weak area. The 4-hour level is clearly bearish, with the price operating below the moving averages and showing weak rebounds.
At the 1-hour level, bearish characteristics are even more apparent. MA5 is at 79838, MA10 at 79931, MA30 at 80661, with the moving averages in a bearish arrangement. MACD’s DIF is -373, DEA is -343, and histogram is -29.75, in a death cross state; although the histogram is shortening, the amplitude is small, indicating that the downward momentum is still ongoing. RSI is 31.16, close to the oversold area. The price is currently operating below EMA55 at 80719, which is a distant margin.
At the 15-minute level, MA5 is at 79783, MA10 at 79900, and MA30 at 79956, with the moving averages in a bearish arrangement. MACD’s DIF is -79, DEA is -66, and histogram is -12.60, in a death cross state; RSI is 43.42, in a weak condition. The short cycle is also under pressure.
To summarize the multi-cycle status: the daily line is in a bullish trend but with weakening momentum; the 4-hour and 1-hour levels are dominated by bears, and the 15-minute level is weakly oscillating. Overall, it presents a contradictory pattern of “bullish in the big cycle, bearish in the small cycle,” making prices easily fluctuate and operations more difficult.
TPV Signal Verification
Now let’s use the Qinglan TPV system to verify the current signal. The core rule is that the 1-hour EMA55 serves as the boundary for bullish and bearish; currently, EMA55 is at 80719, and the price is 79698, clearly below EMA55, so the trend is located in the bearish trend area.
We check the conditions for short selling. First, the price is under pressure below the 1-hour EMA55. Among the past 8 1-hour candlesticks, the number of times the closing price was above EMA55 is 0, crossing times are 0, and there are 2 consecutive 1-hour candlesticks with closing prices below EMA55, meeting the condition. Second, pressure has encountered resistance. From the 4-hour chart, the price has repeatedly faced resistance in the 80000-81000 area, forming a clear pressure zone; the last rebound near 80700 quickly fell back with a clear long upper shadow, meeting the condition. Third, the rebound is weak. The 1-hour MACD histogram has shortened for 2 consecutive cycles; however, note that the histogram has shrunk from around -30 to -29.75, with a very small amplitude, and RSI has barely increased from around 31 to 31.16, indicating weakness in the strength, almost negligible. Overall, the conditions for short selling are basically met, but the signal of momentum exhaustion is not strong enough, belonging to a weak bearish signal.
Oscillation judgment auxiliary data shows that among the past 8 1-hour candlesticks, the number of times the closing price was above EMA55 is 0, crossing times are 0, and the margin between price and EMA55 is 1.27%, not meeting the oscillation threshold; currently, it is in a one-sided trend, with the direction being bearish.
On-Chain/Funding Aspects
On-chain data shows a fear and greed index of 47, in the neutral range, indicating that market sentiment is neither in panic nor greed, relatively bland. BTC's market share is 58.45%, still at a high level, indicating that funds are still huddled in Bitcoin, while altcoins are relatively weak. The 24-hour decline of 1.77% is a moderate drop without panic selling occurring.
In terms of funding, Coinbase's Q1 financial report did not meet expectations, with a 4.7% drop in after-hours stock price, reflecting sluggish exchange business and declining market activity. Block reported a loss of 173 million USD in Bitcoin for the first quarter, but its performance exceeded expectations, with a neutral impact. JPMorgan predicts Strategy's Bitcoin purchases this year might reach 30 billion USD, which is a medium to long-term positive, but difficult to directly drive prices in the short term. Overall, the on-chain funding situation is neutral, lacking incremental funds entering the market.
Key Attack and Defense Positions
The most important resistance level currently is at 80719 where the 1-hour EMA55 is located, also the convergence area of the 4-hour MA10 and MA30, roughly around 80500-81000. If the price can stabilize in this area again, the bearish pattern will be broken, potentially turning into oscillation or rebound. The lower support level is primarily the 79000 integer mark, where the daily MA10 is located, also the prior low area. If it breaks below 79000, the lower support is at 78000, which is the support level of the daily MA30 and a key support at the 4-hour level. Further down, 77000 is the previous dense transaction area and a psychological barrier.
Trading Thought
Based on the current bearish trend, but with the characteristic of weak momentum exhaust signals, Sister Qinglan provides the following trading thoughts.
Direction: Primarily short, but wait for a rebound to near the resistance level before entering, do not chase the shorts.
Entry Conditions: Wait for the price to rebound to the 80500-81000 area, look for a 1-hour long upper shadow or top-finding pattern to appear, and MACD histogram to expand again, with RSI rising from around 30 before falling again, confirming the weakness of the rebound before entering short. If the price directly breaks below 79000, consider lightly shorting but strict stop-loss is required.
Stop-Loss Level: After entering a short position, set the stop-loss above 81500, i.e., breaking above and stabilizing the 1-hour EMA55. If the price breaks above 81500, the bearish logic fails and should exit.
Target Levels: The first target level is 79000, the second is 78000, and the third is 77000. If there is a volume-driven stop-loss signal near 79000, such as a long lower shadow or bottom-finding pattern, partial take-profit can be taken, while holding the remaining position for 78000.
If the price unexpectedly breaks above 81500 and stabilizes, then the bearish view is paused, and it turns into a wait-and-see or lightly trying long position, but needs to wait for a confirmation signal at the daily level.
Risk Reminder
Currently, the market is in a sensitive period of long and short game, and there is a high level of uncertainty regarding geopolitical conflicts and regulatory policies; any sudden news could lead to sharp price fluctuations, so please strictly control your position and manage risks.
Follow Qinglan Crypto Classroom for more trading opportunities! Welcome to visit the official website www.qinglan.org
📊 Qinglan TPV Trading Strategy Backtest Reference
🕒 Last Backtest Time 05-08 07:00:02
Total Analysis: 1376 Backtests: 1370 Accuracy: 67.4% (923/1370)
免责声明:本文章仅代表作者个人观点,不代表本平台的立场和观点。本文章仅供信息分享,不构成对任何人的任何投资建议。用户与作者之间的任何争议,与本平台无关。如网页中刊载的文章或图片涉及侵权,请提供相关的权利证明和身份证明发送邮件到support@aicoin.com,本平台相关工作人员将会进行核查。