Crypto Circle Academician: Where is the short-term north-south watershed for Bitcoin at 58? These two key points determine the subsequent direction! Latest market analysis and operation suggestions
The current price of Bitcoin is at the 80000 mark. I checked the market news, and many crypto friends find that prices drop when they chase rises and rise when they kill dips? News is flying everywhere, and many influencers are shouting to push to 85000 one moment and smash to 75000 the next, making it hard to know whom to trust. Doesn’t it make your head hurt? Today, let’s directly discuss using K-lines, defining the trend on daily K-lines, finding the rhythm on the 4-hour chart, and clarifying the current long and short positions. I'll give you the entry point and stop-loss level directly; after reading, you won't need to look for analyses everywhere, just follow the execution!
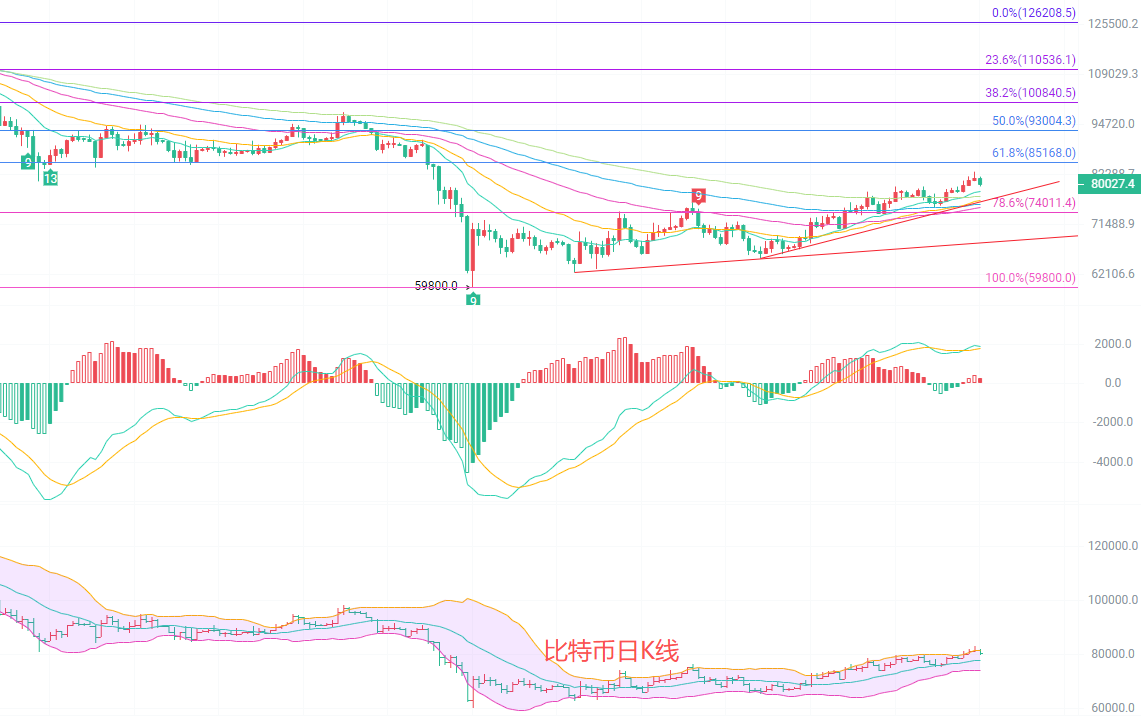
The daily K-line slightly closed down by 1.71%, at a key oscillation level. The price still stands above the 15/30/60-day moving averages, and the upward arrangement of moving averages has not been broken. The middle track of the Bollinger Bands at 77728 forms strong support, while the upper track at 81466 shows significant resistance. The MACD red bars continue to shorten, and although the DIF and DEA are still above the zero axis, the golden cross momentum is gradually weakening, indicating that the northbound strength has weakened in the short term, and volatility at high positions is intensifying as long and short positions are battling at the 80000 level.
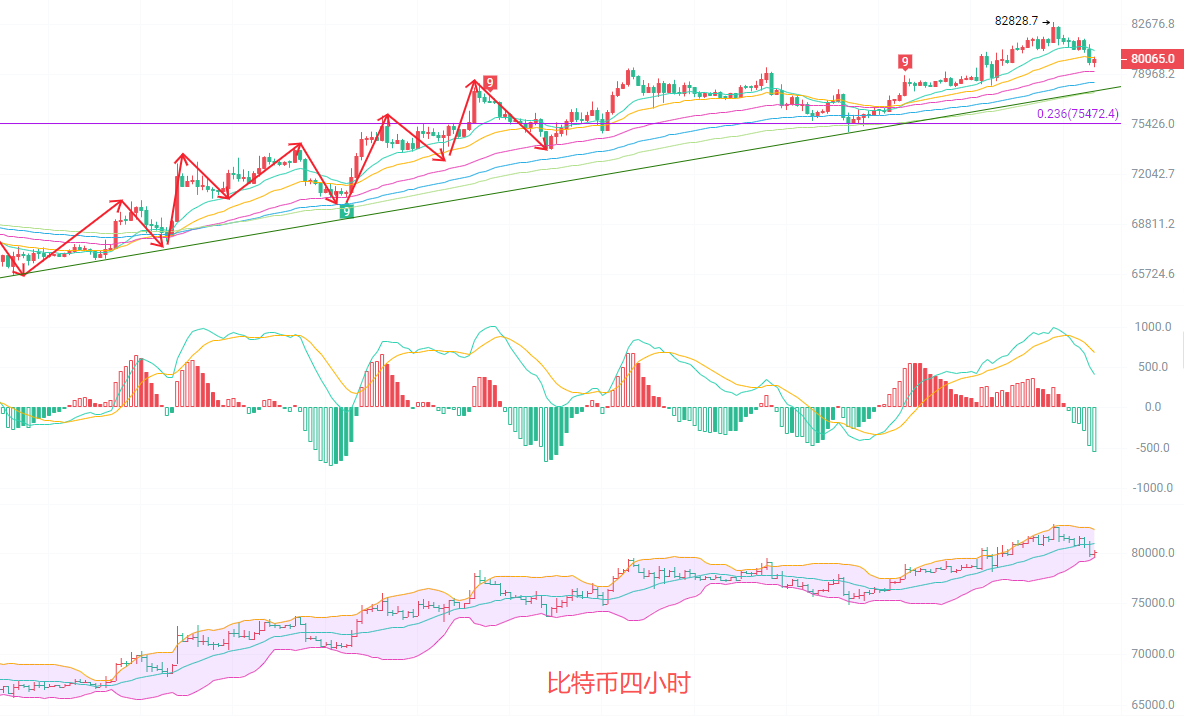
The 4-hour K-line has retreated from the peak of 82828, currently breaking below the 15/30 moving averages, with a short-term trend turning from strong to weak. The EMA15 and EMA30 moving averages are about to form a death cross, and the Bollinger Bands are slightly constricting, with the price falling below the middle track. The MACD has formed a death cross, and the green bars are continuing to enlarge, releasing southward momentum, and the KDJ indicator is also at the edge of being oversold, indicating a short-term demand to retouch the lower track of the Bollinger Band at 79551 for support. The short-term northbound repair signal has not yet appeared, showing a clear weak oscillation pattern.
Short-term strategy reference: Follow the trend of the long cycle, with small stop-losses for quick entry and exit
For movements from 80000 to 79500, set a stop-loss at 79000, targeting 81000 to 81500, and if broken, target 82000
For movements from 81000 to 81500, set a stop-loss at 82000, targeting 80500 to 80000, and if broken, target 79500
The overall trend for Bitcoin has not gone bad, but short-term fluctuations are definitely unavoidable. Don’t think about going all in for maximum profit; use small positions to test, manage your stop-losses well, and keep alive to wait for the market that belongs to you.

Warm reminder: The above content is solely created by the author of the public account. The advertisements at the end of the article and in the comments section are unrelated to the author. Please be cautious in discerning. Thank you for reading.
免责声明:本文章仅代表作者个人观点,不代表本平台的立场和观点。本文章仅供信息分享,不构成对任何人的任何投资建议。用户与作者之间的任何争议,与本平台无关。如网页中刊载的文章或图片涉及侵权,请提供相关的权利证明和身份证明发送邮件到support@aicoin.com,本平台相关工作人员将会进行核查。