1. Geopolitical Game: Reversal of the "Freedom Plan" in the Strait of Hormuz and the Resurgence of Inflation
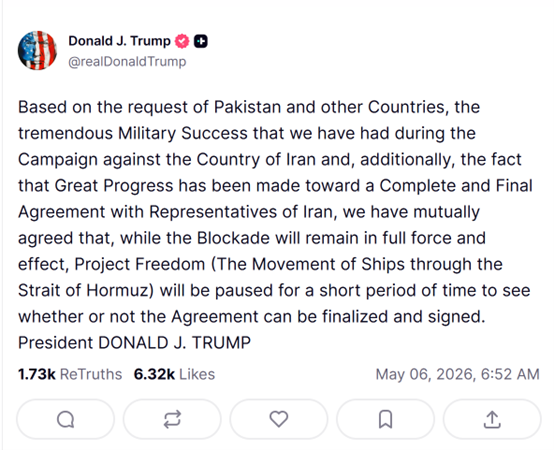
On May 4, 2026, U.S. President Trump announced on Truth Social that the U.S. would officially launch the "Freedom Plan" for the escort of commercial vessels in the Strait of Hormuz on the morning of that day in Middle Eastern time, deploying missile destroyers, over 100 air missions, multi-domain unmanned platforms, and 15,000 active-duty troops. The U.S. characterized it as a "defensive humanitarian operation," aiming to bypass the 60-day authorization period constraints on presidential military actions imposed by the U.S. War Powers Act. However, just a day later, Trump announced again that, in light of "significant progress on the U.S.-Iran Comprehensive Agreement," he'd decided to suspend the execution of the "Freedom Plan" but emphasized that the maritime blockade against Iran "will continue to be fully and effectively implemented." This dramatic reversal caught global markets off guard, causing crude oil prices to experience severe fluctuations following the announcement.
Iran's stance was markedly more hardline than that of the U.S. Iran's Supreme Leader foreign affairs adviser Velayati explicitly stated that the Strait of Hormuz has been closed and will not be reopened unless dictated by the "national will of the Islamic Republic of Iran"; all vessels wishing to pass through the strait must submit applications via official channels and can only proceed after obtaining passage permits from Iran. The Chairman of the Iranian Parliament's National Security Committee warned that any foreign armed forces (especially U.S. troops) approaching or entering the Strait of Hormuz will face retaliation. There are stark differences between the U.S. and Iran in key issues such as the nature of the ceasefire, navigational rights in the strait, and whether the "Freedom Plan" has truly been suspended; the market's pricing of geopolitical risks has yet to reach a point where relaxation is possible.
The direct consequences of this geopolitical game have begun to show up in global inflation data. Due to the ongoing escalation of U.S.-Iran military conflicts and the announcement by the UAE to withdraw from the OPEC+ alliance on May 1, international oil prices rose continuously from late April to early May, significantly pushing up energy prices. Goldman Sachs promptly raised its year-end core PCE inflation forecast from 2.5% to 2.6%, and the overall PCE forecast from 3.1% to 3.4%. More worryingly, the forces driving this inflation surge stem not from excessive demand but from supply shocks (oil prices) compounded with tariff effects, making the Federal Reserve's monetary policy response mechanism more complex—hesitant to raise interest rates for fear of exacerbating economic downturn pressures, while struggling to initiate rate cuts due to rising risks of unanchored inflation expectations. For Bitcoin, this "stagflationary" macro environment has historically imposed dual pressures: its safe-haven attribute has yet to gain broad consensus, while liquidity contraction expectations continue to suppress valuations of risk assets.
2. On the Eve of the Fed Chair Change: Beige Book Alerts and the Crossroad of Policy Independence
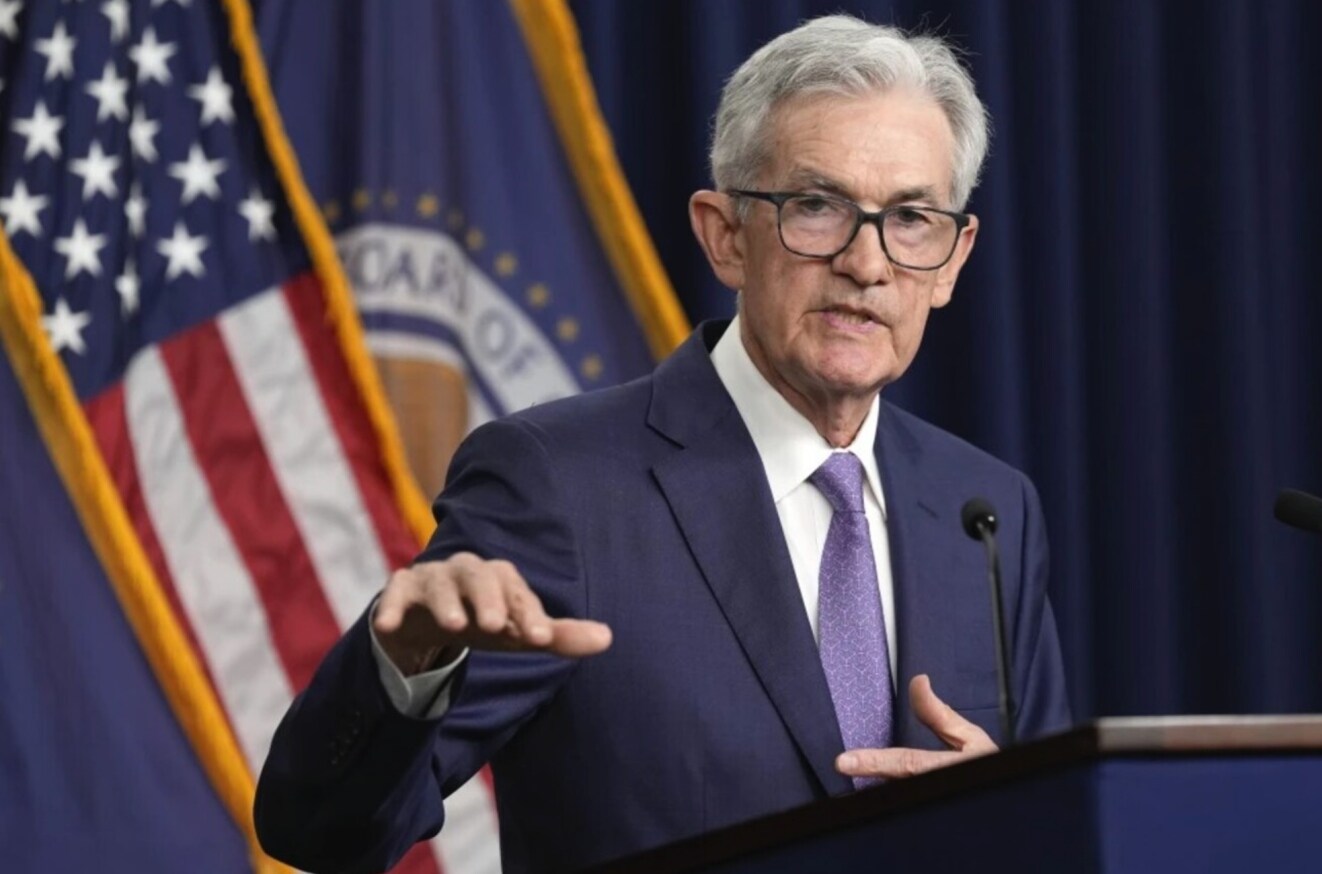
In mid-May 2026, the Federal Reserve is about to undergo the most controversial chair transition in modern history: Kevin Warsh will officially replace Jerome Powell as Fed Chair. Powell, breaking a 75-year tradition, will continue to serve as a Fed governor after stepping down, which the market widely interprets as a political compromise of "incomplete decoupling" between the White House and the Federal Reserve. Warsh's policy stance shows a subtle "hawk-dove mix": hawkish regarding inflation control and balance sheet management, emphasizing monetary policy discipline and framework reconstruction, and publicly criticizing the Fed's ultra-accommodative policies over the past 20 years as "seriously deviating from its mission"; but dovish regarding the long-term interest rate trajectory, recognizing the natural suppressive effect of technological advancements on inflation, supporting rate cuts where data permits. This mixed stance has left the market divided over the monetary policy path in the "Warsh Era," making it a key uncertainty source for macro pricing in the crypto market in May.
The Federal Reserve meeting that concluded on April 30 was Powell's last meeting as chairman. As the market widely expected, the federal funds rate was maintained at 3.50% to 3.75%. The post-meeting statement and Powell's press conference conveyed a complex signal: on one hand, the impact of rising energy prices on inflation "has begun to emerge and may further expand in the short term," and Powell explicitly stated that "currently no officials support a rate hike, but some officials advocate for a less accommodative tone in the meeting statements"; on the other hand, Powell emphasized that after stepping down, he "will not become a shadow chair," attempting to reassure the market of concerns over the Fed's policy independence. However, just days after the meeting ended, internal divisions within the Fed became apparent: Trump-nominated Governor Stephen Moore voted against supporting rate cuts, while hawkish leaders such as Cleveland Fed President Mester and Minneapolis Fed President Kashkari also cast dissenting votes (though in favor of keeping rates unchanged), reflecting a high degree of internal disagreement in the Fed that casts a shadow of uncertainty over the first meeting following Warsh's takeover.
The Beige Book released on April 16 provided valuable grassroots insights into the current state of the U.S. economy. The report showed that 8 out of 12 Federal Reserve districts experienced modest to moderate expansion, 2 districts saw little change in economic activity, and 2 districts encountered modest to moderate declines. The most noteworthy inflation-related statement is: "Energy and fuel costs have risen significantly across all 12 districts," with businesses reporting that input cost increases exceed sales price increases, compressing profit margins. Decision-making for businesses regarding hiring, pricing, and capital investment has become more complex, with "awaiting" becoming the most common business strategy. For crypto assets, the core signal conveyed by the Beige Book is: although the U.S. economy has not slipped into recession, its growth momentum is being eroded by energy inflation, and the path for Fed rate cuts may be more winding than previously expected in the market, which still poses a restraining macro background for a crypto market known for its sensitivity to liquidity.
3. Institutional Deep Waters: ETFs Reverse Cash Inflow and Mining Companies Optimize Balance Sheets
Against the backdrop of Bitcoin prices significantly retreating from their highs, the contrarian buying behavior of institutional funds has become the most noteworthy structural signal in the May 2026 crypto market. According to SoSoValue data, on May 1 Eastern Time, the U.S. spot Bitcoin ETF saw a net inflow of $630 million in a single day, with BlackRock's IBIT capturing $284 million, leading the pack, while Fidelity's FBTC ranked second at $213 million; on May 4, the spot ETF reported another $532 million in net inflow. This capital flow appears significantly divergent from Bitcoin's price movements: prices fluctuated between $76,000 and $81,000, yet ETFs continued to record net inflows, indicating that institutions are steadily building positions despite price weakness, contrasting with the behavior pattern of retail investors who tend to chase prices. By early May, the total net asset value of U.S. spot BTC ETFs had reached $10.3785 billion, accounting for about 6.66% of Bitcoin's total market capitalization. The sustained rise in institutional holdings is fundamentally changing the price discovery mechanism of Bitcoin—from a retail-driven high-volatility speculative asset to a more institutionally allocated asset.
From a more macro perspective, the deepening institutional process is reshaping Bitcoin's supply and demand balance sheet. Since January 2024, when the U.S. spot Bitcoin ETF was approved, ETF channels have cumulatively absorbed over 580,000 BTC, a quantity equivalent to about three years of Bitcoin network output. Meanwhile, the supply from long-term holders has consistently risen since mid-February 2026, indicating that during the price adjustment process, the holding willingness of long-term investors has increased rather than decreased. This dual lock-up pattern of "institutions + long-term holders" causes Bitcoin's actual circulating supply to continually contract, providing implicit bottom support for prices amid macro headwinds.
4. Bitcoin Returns to $80,000: Halving Cycle Laws and the Dialectics of Bull and Bear at the Current Node
At the time point of early May 2026, Bitcoin is staging a critical play of strongly rebounding from a deep correction. BTC had fallen to around $60,000 in early February but rebounded strongly in early May, regaining the $80,000 mark, reflecting a more than 33% rebound from the lowest point of this round of adjustment. This "return to $80,000" trajectory represents a roughly 46% retracement compared to the historical high set in October 2025, but contrasting with the panicked selling by retail investors and large-scale shutdowns by mining companies during the severe bear markets of 2018 and 2022, the 2026 round of adjustments presents strikingly different structural characteristics: sustained net inflows into ETFs, increased holdings by long-term holders, and leading mining companies still optimizing balance sheets rather than cutting production and exiting the market. These signals collectively suggest one judgment—what is currently happening is more likely a "deep adjustment within a bull market," rather than the beginning of a bear market indicating a "bull market has ended."
From the perspective of halving cycle laws, Bitcoin will complete its fourth halving (cutting block rewards from 6.25 BTC to 3.125 BTC) in April 2024, and historical data shows that the 12 to 18 months following a halving is usually the stage of most intense price discovery. Approximately 12 months after the 2012 halving, BTC surpassed previous highs; about 17 months after the 2016 halving, a main upward wave began; about 12 months post the 2020 halving, the cycle peak was reached. If we use this historical pattern as a reference, the 12 to 18 months window following the halving in April 2025 corresponds to the period from April 2026 to October 2026, which is precisely the current timeframe. This implies that the current price adjustments are very likely part of a "washing and building momentum" following the halving, rather than a reversal at the peak of the cycle. Of course, there is a high degree of uncertainty over whether this historical pattern remains valid in the context of deepening institutionalization.
From a technical standpoint, the core battleground range for Bitcoin after its "return to $80,000" is between $76,000 and $83,000. $80,000 itself is an important psychological threshold and short-term support level, while $83,000 is where the 200-day simple moving average lies, also serving as the critical "bull-bear divide" that both sides will fiercely contest; if a daily level breakthrough is successfully achieved, the target upwards will point towards the $89,000 to $94,000 range. The downside at $76,000 represents multiple tests of the low point from April 2026; if it is lost, the technical downward target will point towards the $70,000 to $65,000 range. From the momentum indicators, RSI-7 has risen to 71.27, nearing the overbought zone, indicating the presence of technical correction pressure in the short term; however, MACD formed a golden cross in mid-April, providing some momentum support for mid-term advances. Taken together, the most reasonable judgment at the current node is: BTC is in the "confirmation phase after returning to $80,000," and the range of fluctuations may continue for 2 to 4 weeks until a clear signal from macro catalysts emerges.
5. Outlook: Three Scenario Deductions and Key Observation Nodes
Considering the three main threads of geopolitics, Federal Reserve policy paths, and institutional capital flows, the crypto market from May to July 2026 may evolve along the following three scenarios.
Scenario One (Probability ~35%): Geopolitical Easing + Fed Releases Dovish Signals, BTC Challenges $89,000 to $94,000. If the U.S. and Iran reach a substantial framework agreement within the negotiation window after the "Freedom Plan" suspension, the Strait of Hormuz returns to normal passage, oil prices retreat from their highs, and inflation expectations cool down; simultaneously, Warsh sends dovish signals during his first public speech after taking office on May 15. The simultaneous warming of these two mainlines would trigger a macro "double-click" effect: a significant repair of risk appetite, accelerating ETF inflows, with BTC likely breaking above $83,000 (200-day line) within 2 to 4 weeks and challenging the $89,000 to $94,000 range. Key observation nodes for this scenario include: Warsh's inaugural speech around May 15, the April U.S. non-farm payroll data released on May 8, and milestone announcements from U.S.-Iran negotiations.
Scenario Two (Probability ~45%): Geopolitical Stalemate Continues + Fed Maintains Wait-and-See Attitude, BTC Fluctuates Between $70,000 and $85,000. This is the most fully priced neutral scenario in the current market. Both sides in the U.S.-Iran talks fail to reach a comprehensive agreement during the four-week ceasefire but do not erupt into a new large-scale military conflict, and the Strait of Hormuz remains in a "half-blockade" state; the Fed maintains a "data-dependent" stance after Warsh takes office. In this scenario, BTC is most likely to maintain a broad fluctuating pattern, and ETF fund flows will become the most direct driver of short-term prices—if weekly net inflows remain above $300 million, prices will tend toward the upper bound; if there is a net outflow in any single week, prices will test the lower bound support. Range trading is the most suitable strategy for most investors in this scenario.
Scenario Three (Probability ~20%): Geopolitical Conflict Escalates + Inflation Goes Out of Control, BTC Retracts to the $65,000 to $70,000 Range. If the ceasefire agreement completely breaks down, Iran announces a full blockade of the Strait of Hormuz, oil prices exceed $120 per barrel, and Goldman Sachs is forced to further raise year-end PCE forecasts; hawkish Fed officials publicly discuss the possibility of "raising rates as necessary to combat inflation." This macro "perfect storm" would simultaneously impact liquidity expectations and risk appetite, and BTC might fall below the psychological threshold of $70,000. Although this scenario holds a relatively low probability, if it occurs, leveraged positions in the crypto market will face systemic liquidation pressure. In this scenario, cash and short-term government bonds represent the optimal holdings, and Bitcoin should be repositioned only after confirming macro turning points.
6. Conclusion: Identifying Structural Signals Amid Macroeconomic Fog
In May 2026, the crypto market stands at a historical intersection of three main lines: geopolitical events, monetary policy, and the institutionalization process. The dramatic reversal of the "Freedom Plan," the policy uncertainties brought by the Fed chair change, the verification period of Bitcoin's halving cycle laws, and the structural shifts with persistent ETF reversals in cash flows all together form an extremely complex and richly layered macro chessboard. For investors, the key to understanding this phase lies in distinguishing "noise" from "signal": the back-and-forth nature of geopolitical events and the hawkish-dovish disputes among Fed officials are fundamentally short-term noises—they affect prices on a daily to weekly basis but cannot change the medium-term trend direction indicated by deepening institutionalization and the supply contraction of the halving cycle.
Macroeconomic headwinds are often the best friends of long-term allocators. The macro pressures experienced by Bitcoin in May 2026—rising oil prices, uncertain Fed hawkish-dovish dates, and ongoing geopolitical conflicts—are actually much milder compared to the darkest moments of the "liquidity crisis" in March 2020 and the "FTX collapse + Fed's aggressive rate hikes" in 2022. Furthermore, the continuous rise in institutional holdings, the ongoing expansion of ETF product lines, and the fact that leading mining companies can still optimize capital structures during downturns, all quietly tell a greater narrative: Bitcoin is gradually evolving from a marginal speculative product into a permanent member of the global asset allocation landscape. This process is full of fluctuations, but the direction is clear. We recommend closely monitoring three key variables: first, Warsh's inaugural speech around May 15 will determine the re-pricing direction of rate cut expectations; second, substantial progress in U.S.-Iran ceasefire negotiations within the four-week window will determine the evolution paths of oil prices and inflation expectations; third, if the weekly fund flows of U.S. spot BTC ETFs exceed $500 million for two consecutive weeks, it will signal a most direct signal of institutions accelerating their positions. The macro fog will eventually clear, and those investors who maintain composure in the fog to identify structural signals will be the most composed winners in the next round of trend.
免责声明:本文章仅代表作者个人观点,不代表本平台的立场和观点。本文章仅供信息分享,不构成对任何人的任何投资建议。用户与作者之间的任何争议,与本平台无关。如网页中刊载的文章或图片涉及侵权,请提供相关的权利证明和身份证明发送邮件到support@aicoin.com,本平台相关工作人员将会进行核查。


